Spring Exhibition, otherwise known as; Blue Sky

I really like semicolons. Ok.

Every year in PLP, we have two exhibitions. In the first exhibition, otherwise known as the winter exhibition, the topics vary. This year we did Star Wars, and last year we did the environment. The second exhibition is the spring exhibition. This, this is Blue Sky. 

Blue Sky was a concept created by 3M, where people were given time to find a problem and fix it. So, that is what we do. But, we had a few restrictions. The grade nines (pertaining to the fact that this project was multi-grade) had to find a problem within a department. My department was kitchen.

Using the launch cycle, I created an amazing product. And that’s how this blog post is gonna go!

Look, listen, learn

I didn’t really get to choose my department, because I was away while we chose, so I had to really think hard for something to make. But, then, I got it! 

You know when your looking after kids, and cooking, then you have to go check on the kids, and you bring you utensils, then leave them there, and it’s a mess? Well, that was the problem I was trying to fix. 

Now that I had my idea, I wanted to get some perspective. So, I started emailing people. 

Ask tons of questions

First, I researched several cooing stores in North Vancouver. I then proceeded to email several of them, including Cook Culture and House of Knives.

House of knifes got back to me very quickly, and I was able to ask them several questions. They gave very detailed responses, and it was great to talk to experts about this.

Cook Culture also contacted me back soon after I emailed them. They also answered my questions, and I was able to figure out more of a direction for my product.

During these interviews, the main question I was asking was

“Do people often come in asking for storage for utensils while cooking?”

This was due to the fact that I needed to find out if my problem was an actual problem. Both places said that those were a big seller!

Understand the Problem

With the information I got from my interviews, I was able to get a better angle on my problem. I realized what exactly the problem was, and some barriers it would have. For example, I would have to make sure nothing dripped. Also, the design would have to be food safe.

Navigate Ideas

Now that I understood my problem, I had to figure out what I was going to do for this. I decided I wanted it to create an apron that had pockets for tools. For this, I had to figure out what the most useful tools would be. So, I went back to my interviewees, and asked their advice. They said that the top sellers for utensils were; wooden spoons, chef knives, whisks, and spatulas. I wanted to make pockets for each of these things on my apron. So, I got to prototyping!

Create a Prototype 

My first prototype was digital.

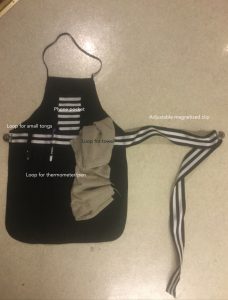
As you can see, I chose to have places for many tools other than just the ones that were recommended. All these tools we’re going to have Velcro straps on them that had magnets, so it would be easy to put the utensils there. The straps would also have magnets, so it would be accessible for people of different sizes.

I got a lot of feedback from this. First, most people didn’t recommend having knives on it. Something about safety, and dying. Anyways. Also, dripping wasn’t exactly taken into consideration for this draft. So I kept my main idea, and moved on to the next step.

Highlight and fix

For the second draft, I created a digital model.

But then created a physical model. I took out nice place, and was trying to figure out some sort of drip tray.

So, I took this draft to Cook Culture, to get feeback (no pictures). Anyways. The manager really liked my idea, but thought I could take it another direction. See, kitchen aprons haven’t really changed since they were invented. I took this feedback, and changed my driving question to

“How can I make an apron that is more modern and can  store utensils?”

So, I can up with my final model. Again, I first made a digital model.

This model still carried utensils, but utensils that wouldn’t drip. It also had a phone pocket, because most people have their phone on them while cooking.

This model also had an adjustable magnetic strap, which I think is pretty awesome.

Launch to an audience

Now, the exhibition night. But, this started even before then, because the teachers had to 8s, 9s and 10s into groups for the night. There were 5 groups in total, based on the grade 10s project. The grade 10s we’re finding ways to solve the UN’s sustainable development goals. I was in the ‘Sustainable Consumption and Production’ group.

We had to figure out how to turn our space- the back of the library- into something that reflected our goal. We worked together to find food, drinks, and decor that fit.

And I think it turned out really well. I got to show my project to tons of people, including the new PLP kids! Someone even was interested in purchasing my thing! It went so well.

I am very proud of my work this exhibition. The project was something that I was interested in, so I was motivated to do a good job. I also learned a bunch about interviewing, and got to work on my people skills. This was an awesome project, and I’m so glad it turned out well!

Peter Verigin and the Doukhobors

https://youtu.be/CpFNgdIrz3A

Yup. So that was that.

We started off this unit by reading Chester Brown’s ‘Louis Riel’, a comic-strip biography. Each part, pertaining to the fact that the book is split into 4 parts, we were to do a summary. Now most of these summaries were written, but our third was a video. So here it is. 

While reading this book, we were also learning about the Métis people and the red river settlement. The red river settlement was a settlement of Métis people. Louis Riel lived here, and the red river rebellion was what brought him to power. In his life, Louis Riel accomplished many things, and brought attention to some of the problems facing First Nations people.

https://youtu.be/Cnr3gWgsdzQ

At this time, the Canadian govt. was trying to get as much land as possible, to avoid annexation with the USA, and to build the Canadian Pacific Railway. They also just wanted more white people in Canada.

Numbered Treaties

The Canadian govt created several different treaties with the First Nations people. These insured the Canadians that they got the land, but were completely unfair for the First Nations people. Some language on the treaties they didn’t understand, and they mistook Xs for the cross, and took it as a sign of peace. Learn more about it here!

BC

In 1867 Canada became a country. But, BC wasn’t. At this time, BC was an independent colony of Britain. It had become populated after the Cariboo Gold rush, which brought tons of people, money, and camels to BC. After the gold dried up, many people left, but many also stayed, populating BC with white people. (I put this here because BC was already very populated with First Nations people, but they came anyways. There was almost a war to. Learn about that here!)

What they had to decide, was wether or not to join Canada. There were three main views on this; join with Canada, stay independent, or become part of the United States. Eventually, they decided to join with Canada, but they had many conditions. One of the promises that the Canadian government made to British Columbia was that the rail road that John a McDonald had previously promised would end in BC. The rail road was also supposed to be finished in 10 years, with a two-year start date. This did not happen as the construction of the CPR began in 1881. The last spike was driven in Craigellachie BC on November 7th 1885. Learn more about this here!

While on our trip to Calgary, we actually got to visit Craigellachie. It was so cool to see where so much history happened. Also, a bunch of trains passed while we were there.

Power

Now, in PLP fashion, while all of this was going on, we were working on a project. Using our driving question, 

How do disparities in power alter relationships?

Now, in PLP fashion, while all of this was going on, we were working on a project. Using our driving question, 

We had to, well, do a thing. First, we chose topics from categories such as the CPR, Red River Settlement, and Manitoba. I chose from the Immigration category, and I chose the Doukhobors. I wanted to do the doukhobors because they settled in the area that I used to live in, and that sounded cool to me. 

Second, we had to research our people. We were supposed to choose one person to focus on for this, so I chose Peter Verigin. He was the leader of a large group of doukhobors during the time when they came to Canada. I won’t say anything else so to not spoil my video. 

Next, we were to write a story based on our research. Lucky for me, I had written my research in a story-esk form. So all I had to do was tweak it a bit. 

These seem like a lot of steps, I know. But the final product is so worth it, so stay with me.

After the story, we had to make a storyboard. A storyboard shows the shots you are going to do for your video. I used Sketches Pro, a really cool drawing app for this.

I did end up changing a lot of this, but anyways. 

Then we animated. Oh my goodness, this took a long time. 3 weeks we spent animating. I used an app called FlipaClip, which helped, but it was still a long time. I’m very proud of how this turned out though. 

We had a viewing party on Monday, where we watched all the videos. It was really cool to see everyone’s topics, and the approach they took to animate this. 

This was a really cool project that I would definitely recommend. I learned so much about the doukhobors, and their tragic story. If I were to go back, I think I would have bought an iPad Pro. I drew most of the slides with my fingers, and it took so long. But I had a lot of fun, and learned tons. Not just about the topic, but about animation. I have so much respect for animators now!

Moderately Similar and Stuff

THIS IS MY LAST GRADE NINE MATH POST. I REPEAT, MY LAST GRADE NINE MATH POST. Wow, it’s been a long year. It’s the end of an era. Math 9, what a class. To go out on a bang, our last project was pretty much entirely up to us. Yup. 

Correlation. Causation. Similar, but not the same. 

We started off this project by looking at a bunch of correlating data. Correlation is when to unrelated points of data follow the same trends. For example, this graph that there is a photo of right here. As you can probably figure, Nicholas Cage movies and the number of people who died by falling into the pool have nothing to do with each other. But the data follows relatively the same pattern. Correlation! Some correlating data has an outside reason that effects them both, but the don’t have to. 

Causation, as I fore mentioned, is similar. But this time, instead of them being unrelated, the directly impact each other. You see, in causation, one data point causes the other. For example, this graph of temperature and ice cream sales. They do follow the same trend, but what makes them causation is that the rise in temperature directly causes the ice cream sales to rise. 

Starting off also, we watched this TED talk that used correlation and causation in their explanation. They used an application called Gapminder, that some of us used in our projects.

For this project, we had to create to questions, one correlation, one causation. I worked with the wonderful Tamara Soltys-Lee. Our questions were as follows. 

“Does the cost of university have a correlation with homelessness?”

And

“Does the time it takes a person to walk to school have a causation with the amount of music they listen to per week?”

(I just found this feature and I think it’s really cool)

I’ll start with the not latter of the two. 

To do this, we had to delegate. I was to research the homeless population from 1992-2014 (because that’s the time frame I could find), and Tamara was to research university tuition. I ended up searching for quite a while, until I found the stats for Calgary’s homeless population. So, I used that data. Tamara, on the other hand, found her information on Pen State University. So they’re really not related. Anyways, we took the information that we found and put it into a chart on numbers. Now, numbers has many great features, including a feature that makes it so you can automatically input your data into a graph. 

(My YouTube is being annoying right now but here there will be a video showing this.)

Our data resulted that these two things follow the same pattern, so, they are correlated!

Now, for the latter of the two!

To get the information for this question, we created a google survey. We then proceeded to send the link to people, via airdrop and social media. We got 20 people to complete our survey!

With this data, and a bit of other research, I was able to put each of these things into a graph. Now, this is where it took a while. I took me three tries to graph the data into a form that would show correlation. Finally, we asked the teacher, and he suggested this.

There would be a best fit line, but I couldn’t find one.

After we collected all this data, we presented it in a keynote!

If I were to do this project again, I would do it exactly the same. Everything went very well.

SLCs the fourth: TPols

In regular school, people have parent teacher conferences, where the teachers fall the parents all about how were doing. Our teachers believe that the only people who can tell our story is us. So, we have 2 ‘student lead conferences’, or SLCs, throughout the year. At the end of every year, we have the Transitional Presentation of Learning. It’s absolutely terrifying, so yeah!

Question 1- What skills did you use and what skills do you want to continue to develop?

To answer this question, I wanted to choose an example from Maker. To be more specific, Destination Imagination. 

I honestly don’t think I learned more from a project than this one. A lot of that was due to our group, though. We worked really well together, and I think that totally contributed to our success. But that doesn’t mean we didn’t have any hiccups along the way. We had so much to revise after our first performance. We almost redid everything. But it was a building block. 

As you may know, I have always had some issues with working in a group. I have been trying very hard to work well with others, and I think this project demonstrates that the best. I know I still have lots to work on in terms of this, but every group project gets me closer.

Question 2- What project did you most enjoy? Why?

To answer this question, I’d choose the WW1 project in Humanities.

I had a lot of fun during this project. This was because I got to reaserch my great grandfather, and see what kinds of things he did in the war. Doing a project on him, I really felt motivated to do my best work, to honour him. In every draft I had, I was motivated to do my best. After every critique session, I went back and revised. This is some of my best work, and I am very proud of how it turned out!

Question 3- What was especially satisfying to you about the process of working on projects?

To answer to question, I want to choose the Cloning project from Science.

In this project, we had to clone different plants. I found this project really cool, and I learned a lot from it.

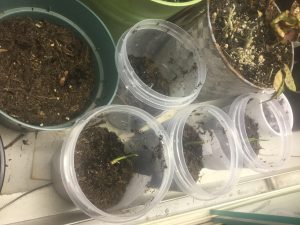
Our first clones were dandelions. After planting, we had to wait and see if they sprouted. Soon, we realized that our dandelions hadn’t made it. But we didn’t dwell on that. We kept moving forward. We planted our garlic plants. These went amazing. It was really amazing to see how we had created life, from just a clove of garlic. It’s always amazing to see the final product of all the hard work that we do.

Question 4-   How do these projects connect to the adult world outside the classroom?

For this question, I want to choose an example from Math, specifically the polynomials project.

In this project, like a lot of our math projects, Mr Gross gave us a vague outline for the project, and we had to come up with a project. (That’s not supposed to sound bad). We also worked in partners, whom were chosen for us. I was working with Luca OG, whom I’d never really worked with before. So that was something.

For the actual project, we had to come up with a question, and make a presentation for it. We chose ‘How are polynomials used in architecture?’. This is directly related to the outside world because architecture is something in the adult world.

We did the project, and presented it. It was after that we got critiqued. I kinda found that weird, but whatever. Anyways. After we presented, Mr. Gross gave us feedback, and we went back and revised.

For grade ten, I have a few goals. First, to prioritize my work, so I can do better work and not be stressed. Finally, I hope, next year, to continue to work on my group work skills.