Introduction
Hi everyone, welcome back to another blog post. This is another summative blog post but this post is a summative post for our most recent Scimatics project. This project was a project based on correlation and causation. We had to survey people and use the answers to create graphs and identify correlation and causation.
What was this project all about?

This project’s main focus was on the identifying correlation and causation and showing correlation in charts, scatterplots to be exact. To do this we had to craft a surgery with questions that we thought would show correlation and causation.
Curricular Competencies
In each project we have 3 curricular competencies that we are assessed by, these competencies make up our grade. This year we are not getting letter grades for our report cards which in my opinion is lunacy.
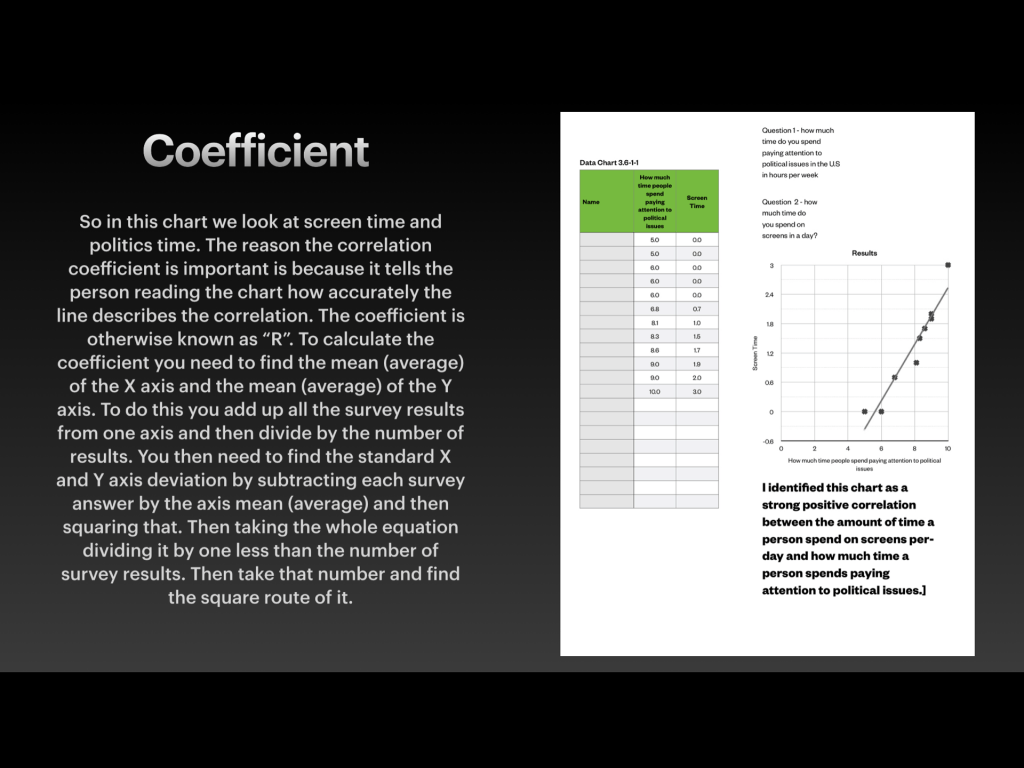
Planning and conducting: (Select and use appropriate equipment, including digital technologies, to systematically and accurately collect and record data). To show this competency I extended and found the correlation coefficient of one of my charts. I used the coefficient to show how accurately the line in my scatter plot described the linear relationship between two variables.
Communicating and Representing: (Use mathematical vocabulary and language to contribute to mathematical discussions). To show this competency I used verbal and Pictorial explanations to explain correlation and causation and help the audience understand the circumstances of my charts. I also had a logical explanation for causation in one of my scatter plot charts.
Applying and Innovating: (Contribute to care for self, others, community, and world through individual or collaborative approaches). I used good ethics when creating my survey to show this competency. My survey was anonymous non-intrusive and had no real personal questions. I also used my class time to the best of my abilities.
What did this project include?📜
In this project our final product was a presentation of our scatter plot charts and our explanations for correlation and causation. This was a far more difficult task to achieve than I thought it would be.


In this project we also had to craft a survey with unbiased questions that followed good ethics and that had questions that showed a correlation and had a causation. This task had its ups and downs for me. My survey had sting results that had correlation and causation but not many people actually took my survey.
Final thoughts 🧠
My final thoughts on this project. I have been really questioning PLP and how they conduct their grading and how project based learning works. I enjoyed this project and the lessons it taught me were a really interesting, so thanks for reading. I hope you enjoyed see you next time!


Be the first to comment on "Correlation VS Causation Summative Post"