Hi. You thought you could get stay away from more of my blog posts?! But you are wrong!
Here is yet another one.
The second scimatics project of the year, more of a math based project called 🔆causation v.s. Correlation 🔆

This project was not bad, was it harder the expected? Yes. But was it the worst project I’ve ever done? No it was not.
So it stared off like very other scimatics projects ever, with a mind map.
 That was not to challenging, since I didn’t know much about causation & Correlation I had lots of unanswered question and curiosities
Next we did this fun social :/ activity where we went around our whole class and asked each person their height and their hand size, then we put that information into a graph in numbers and it put all that information into a graph a that would either present correlation or not.

Then there was a couple work sheets
if you can’t read it, you wouldn’t be the first
Then we got to choose out partner, I got the Lovely opportunity to work with Claire
So after we made a couple shaded numbers no ages documents we were full swing into the first step of the project.
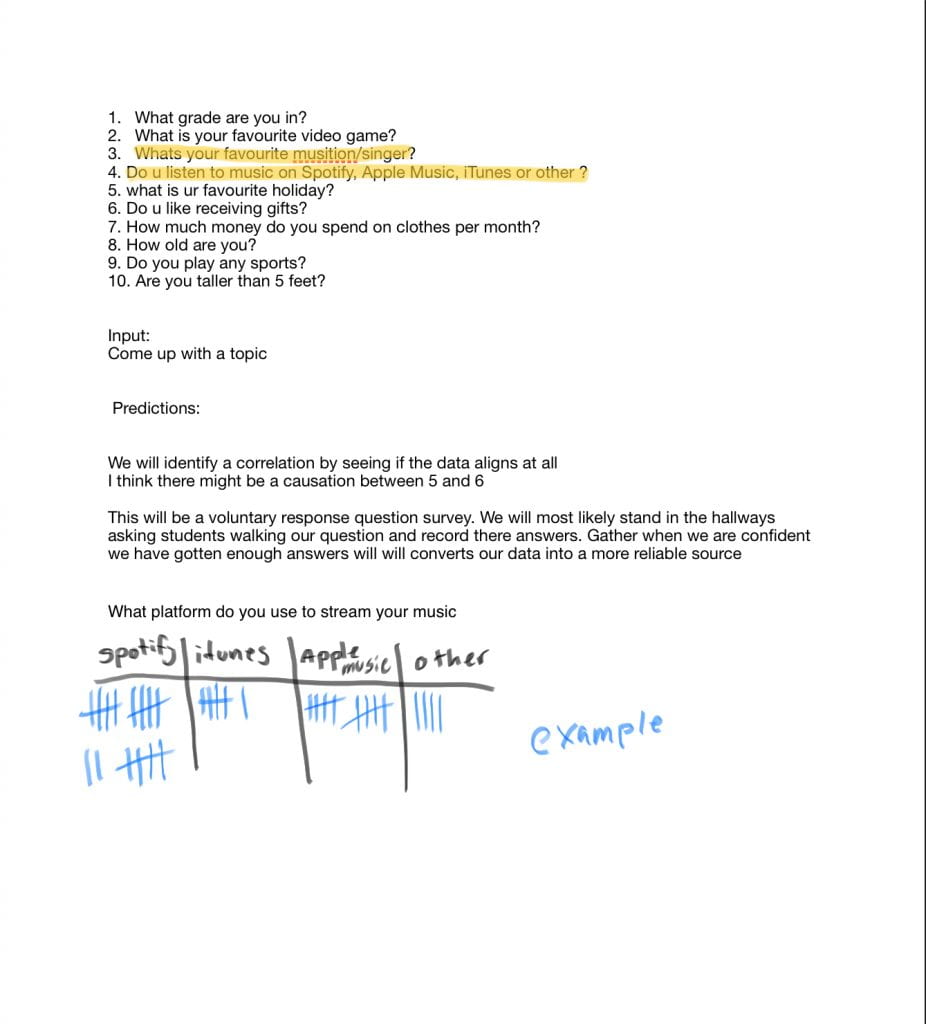
We had to think up 10 questions, establish a theme, identify where possible correlation could be found, identify what type of survey and sample our survey would be and figure out how we would use numbers to collected our now information
(First try 😉
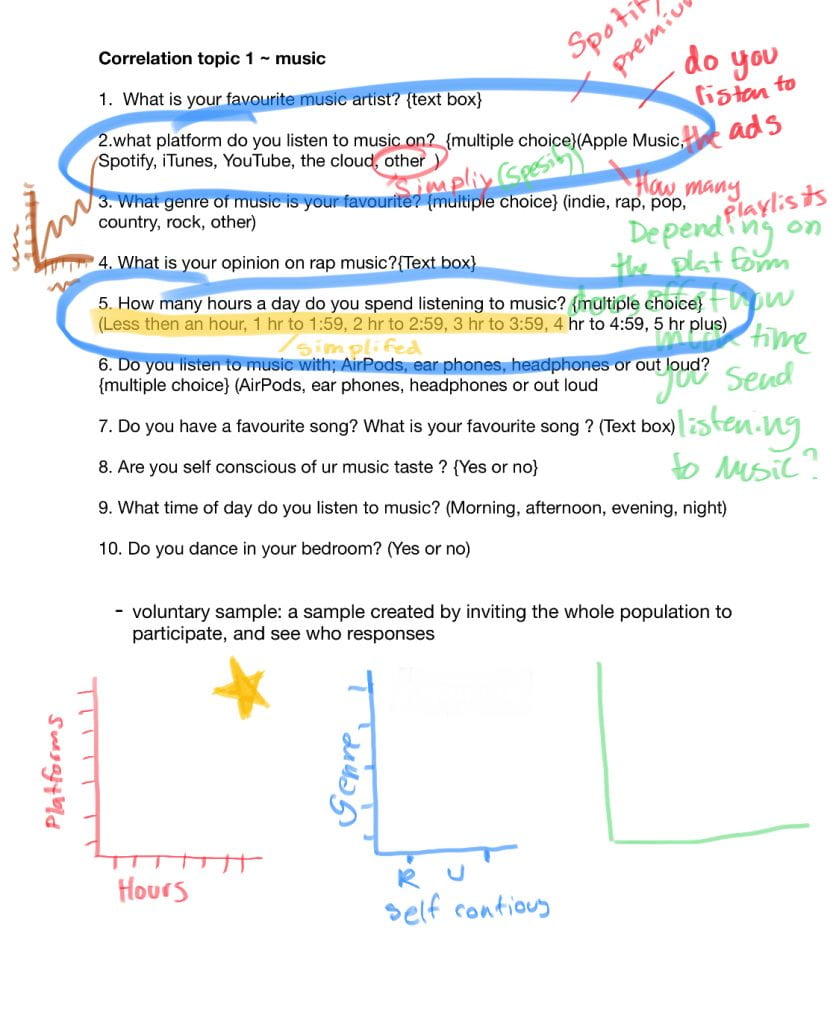
It took a couple try’s, ill tell you that. First tempted wasn’t “finished” and we were missing a couple more questions, do we added then added a couple of extra ✨spice ✨And then finally after our second time we were happy with out planning. After a few last minute changes were made. Finding out a second correlation we were happy with the end request for milestone 3
(Minus all the “annotation”)
milestone 4 was the actually graphing/survey part.
First we copied and pasted all our surveyor questions into a lovey handmade google document survey and called it “music survey”

Once we were happy with the layout, questions and “about our survey” we sent it out to a lot of people, through Snapchat, instagram and iMessage. In the end we got around 40 responses all around the same age rage.
next on the process list was “presentation planning”
we just created a script, went over what we need in incorporated into our presentation and then find lined very detail and ended up with this..


core competencies :/
Planning and conducting:
We found what we were looking for the say the least, well to some degree. We sent out our survey with three correlations in mind, but only two of the three were actually found and well represented. Overall we both had a good understanding of the differences between causation and correlation
communicating and representing:
In the end me and Claire had a solid presentation. Is there room for improvement? Yes, quite obviously but we did well, we had a clear explanation of the difference/definition of causation and correlation, we had proper evidence of our graph info and answers. And we showed our questions of why we asked them in the first place.
applying and innovating:
Over all I think me and Claire did fairly well in this competence, although we may have have been off task for a class or two we made it all work and in the end we were proud of our incorporation and representation of good ethics
thank u for reading yet another one of these quite continues and repetitive blog posts 🙂
that’s all thanks
hannah 🥫🥧🍯🫑🧊🍆