Correlation? Causation?
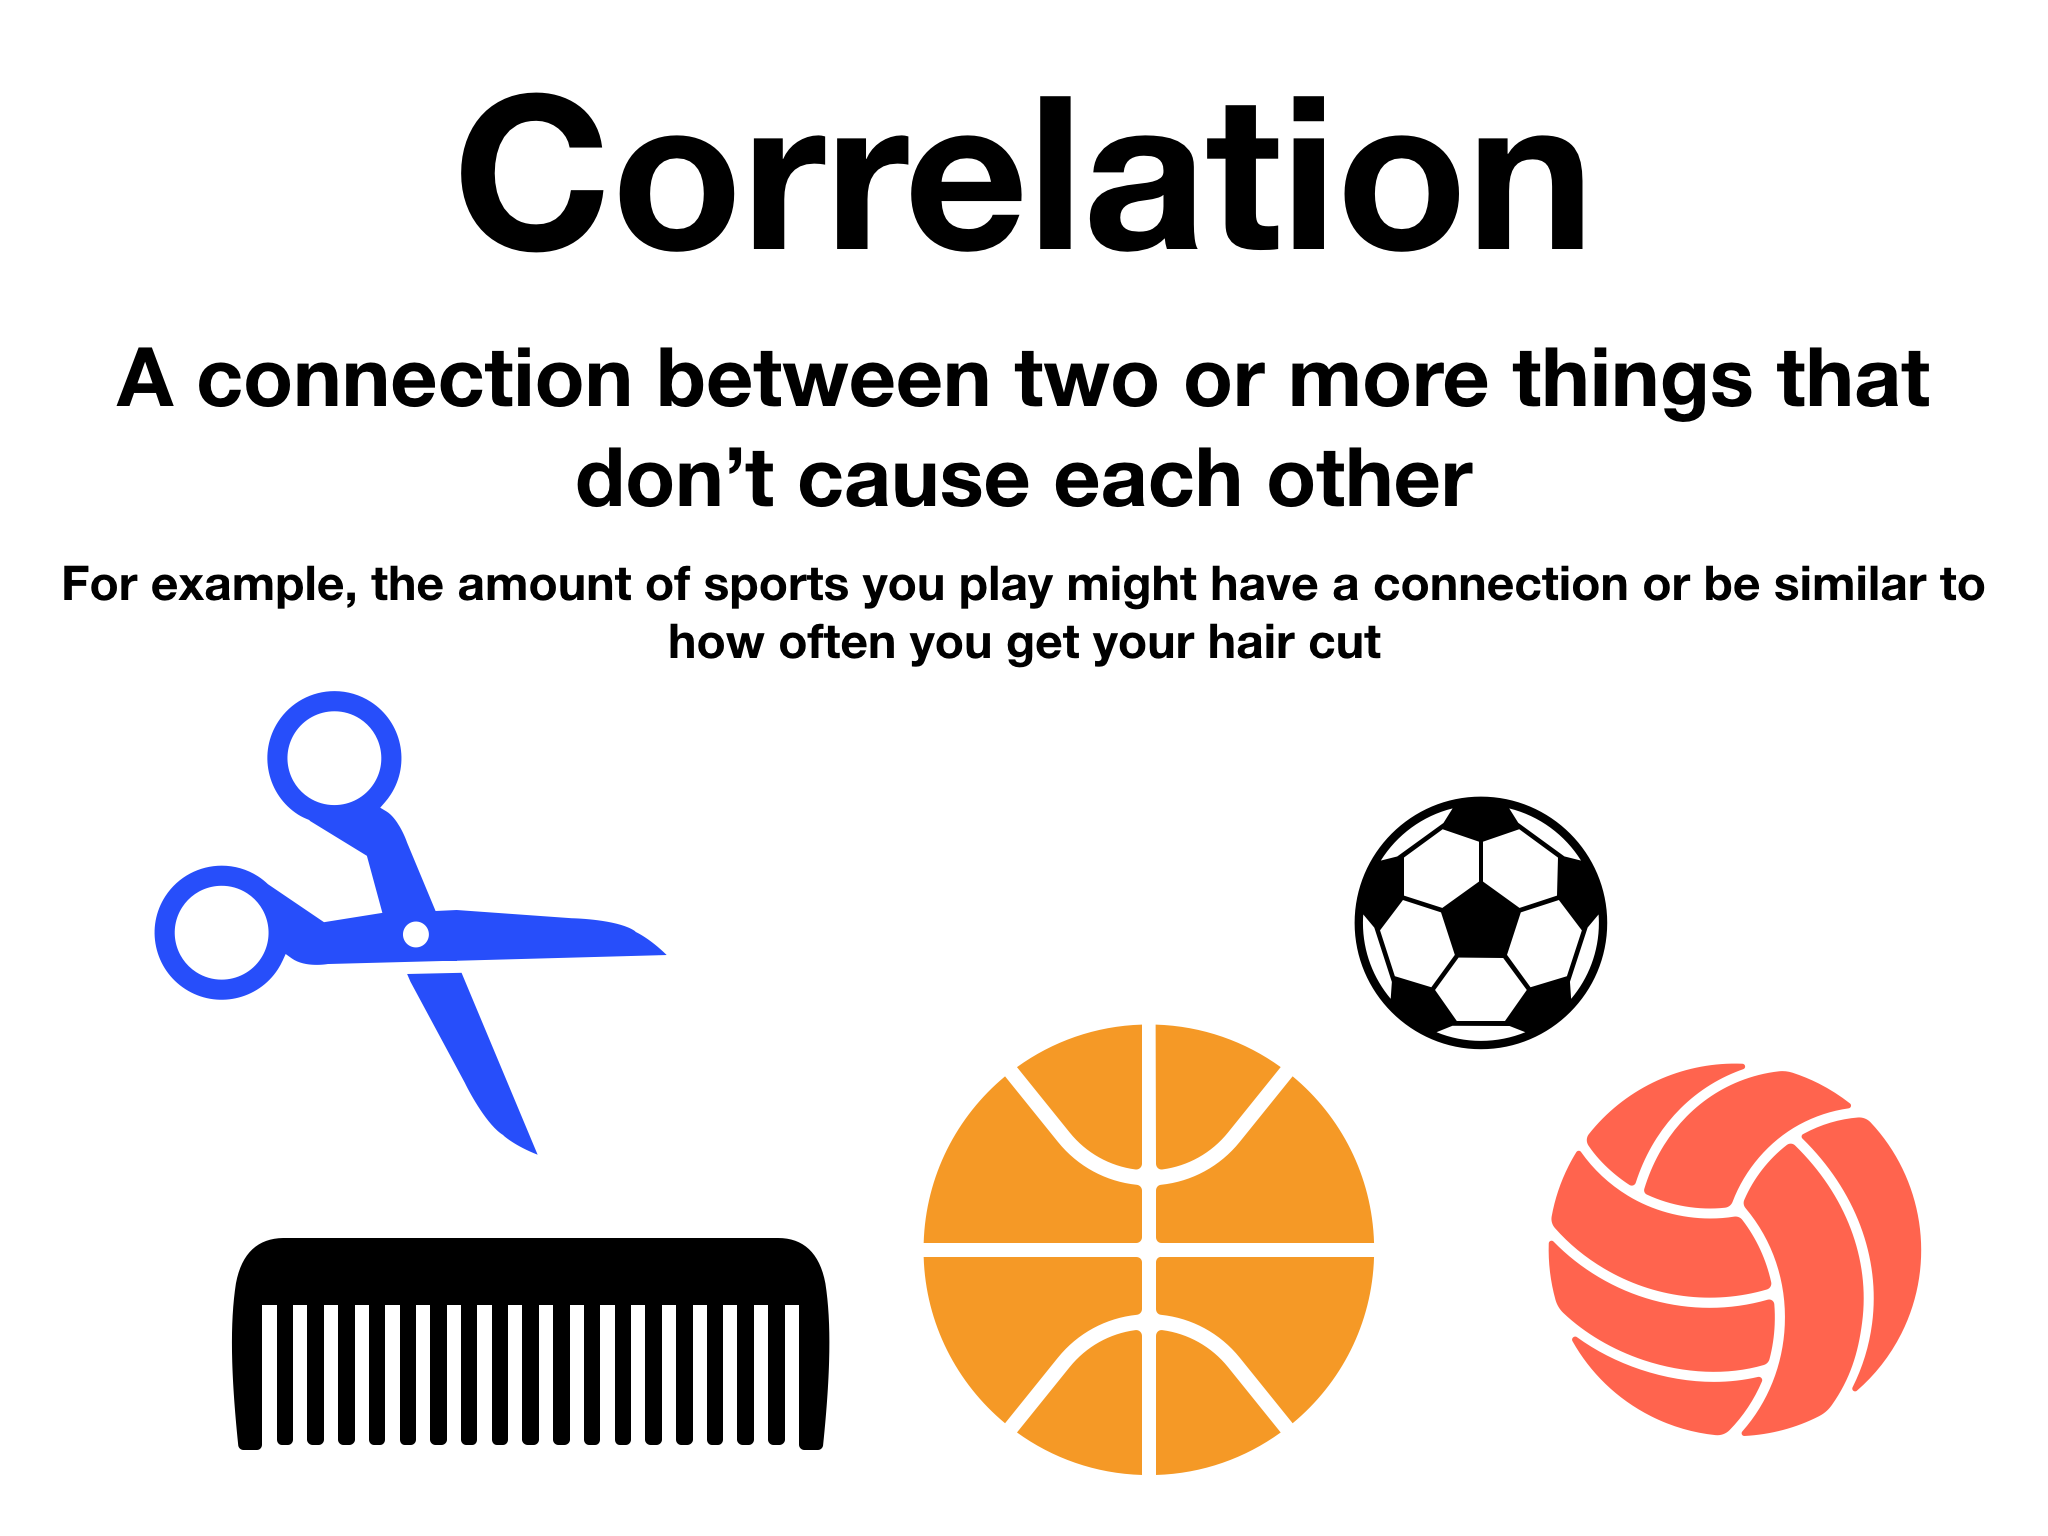
We just finished our last math unit. This unit was on correlation and causation. We learned about what each one meant, and the difference between the two.
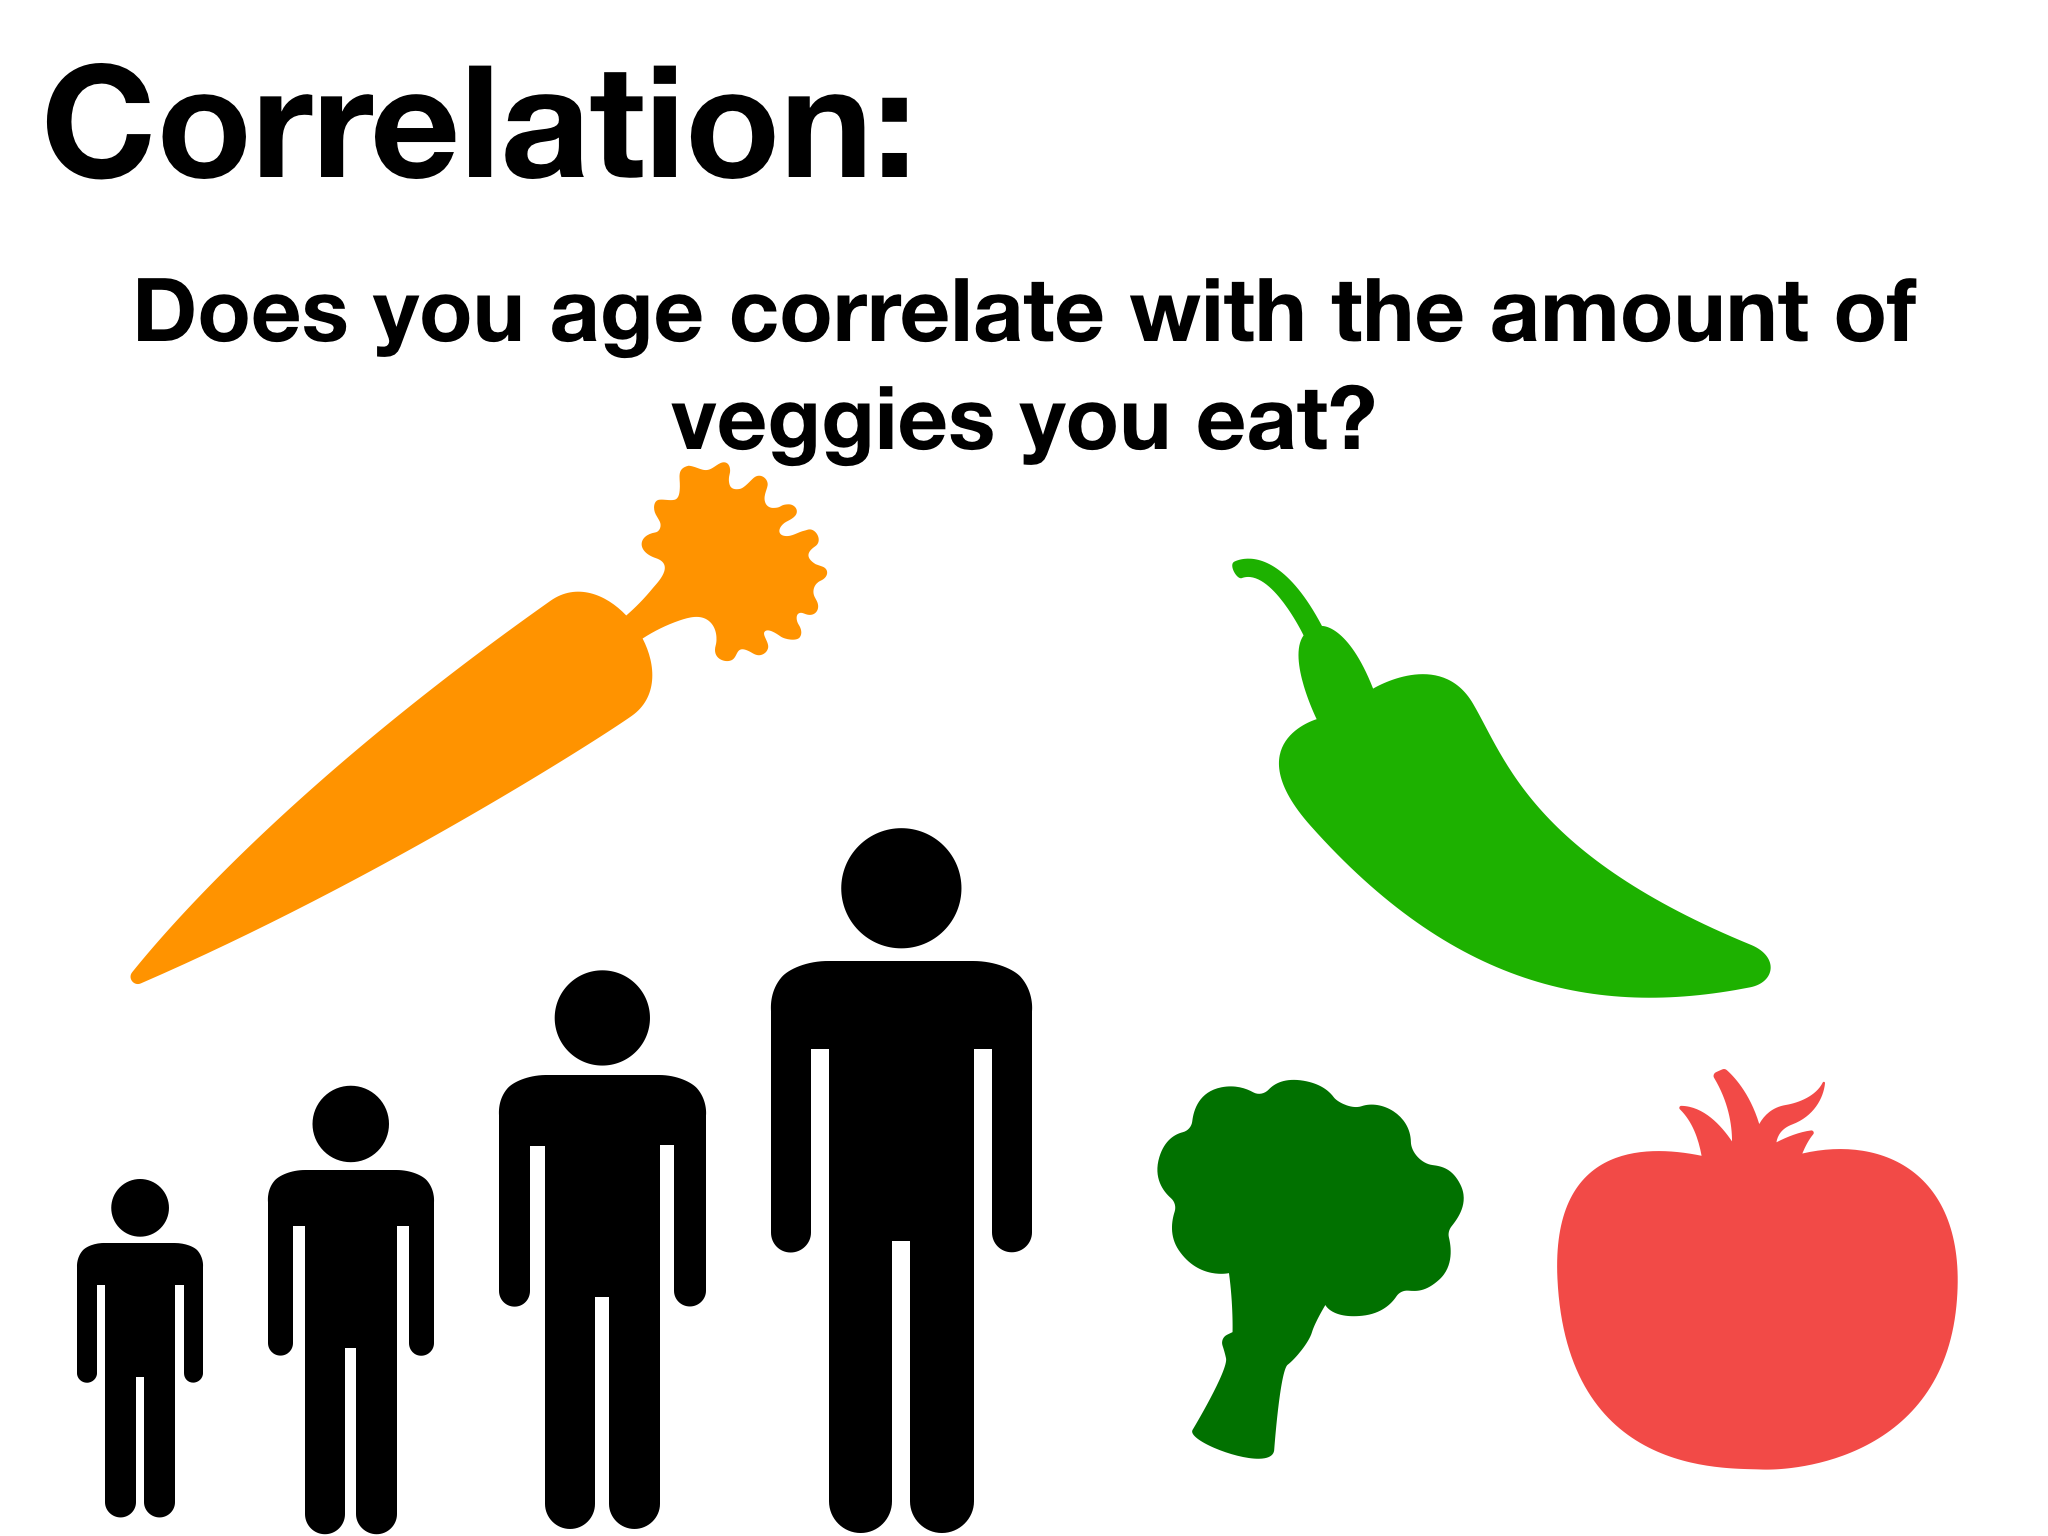
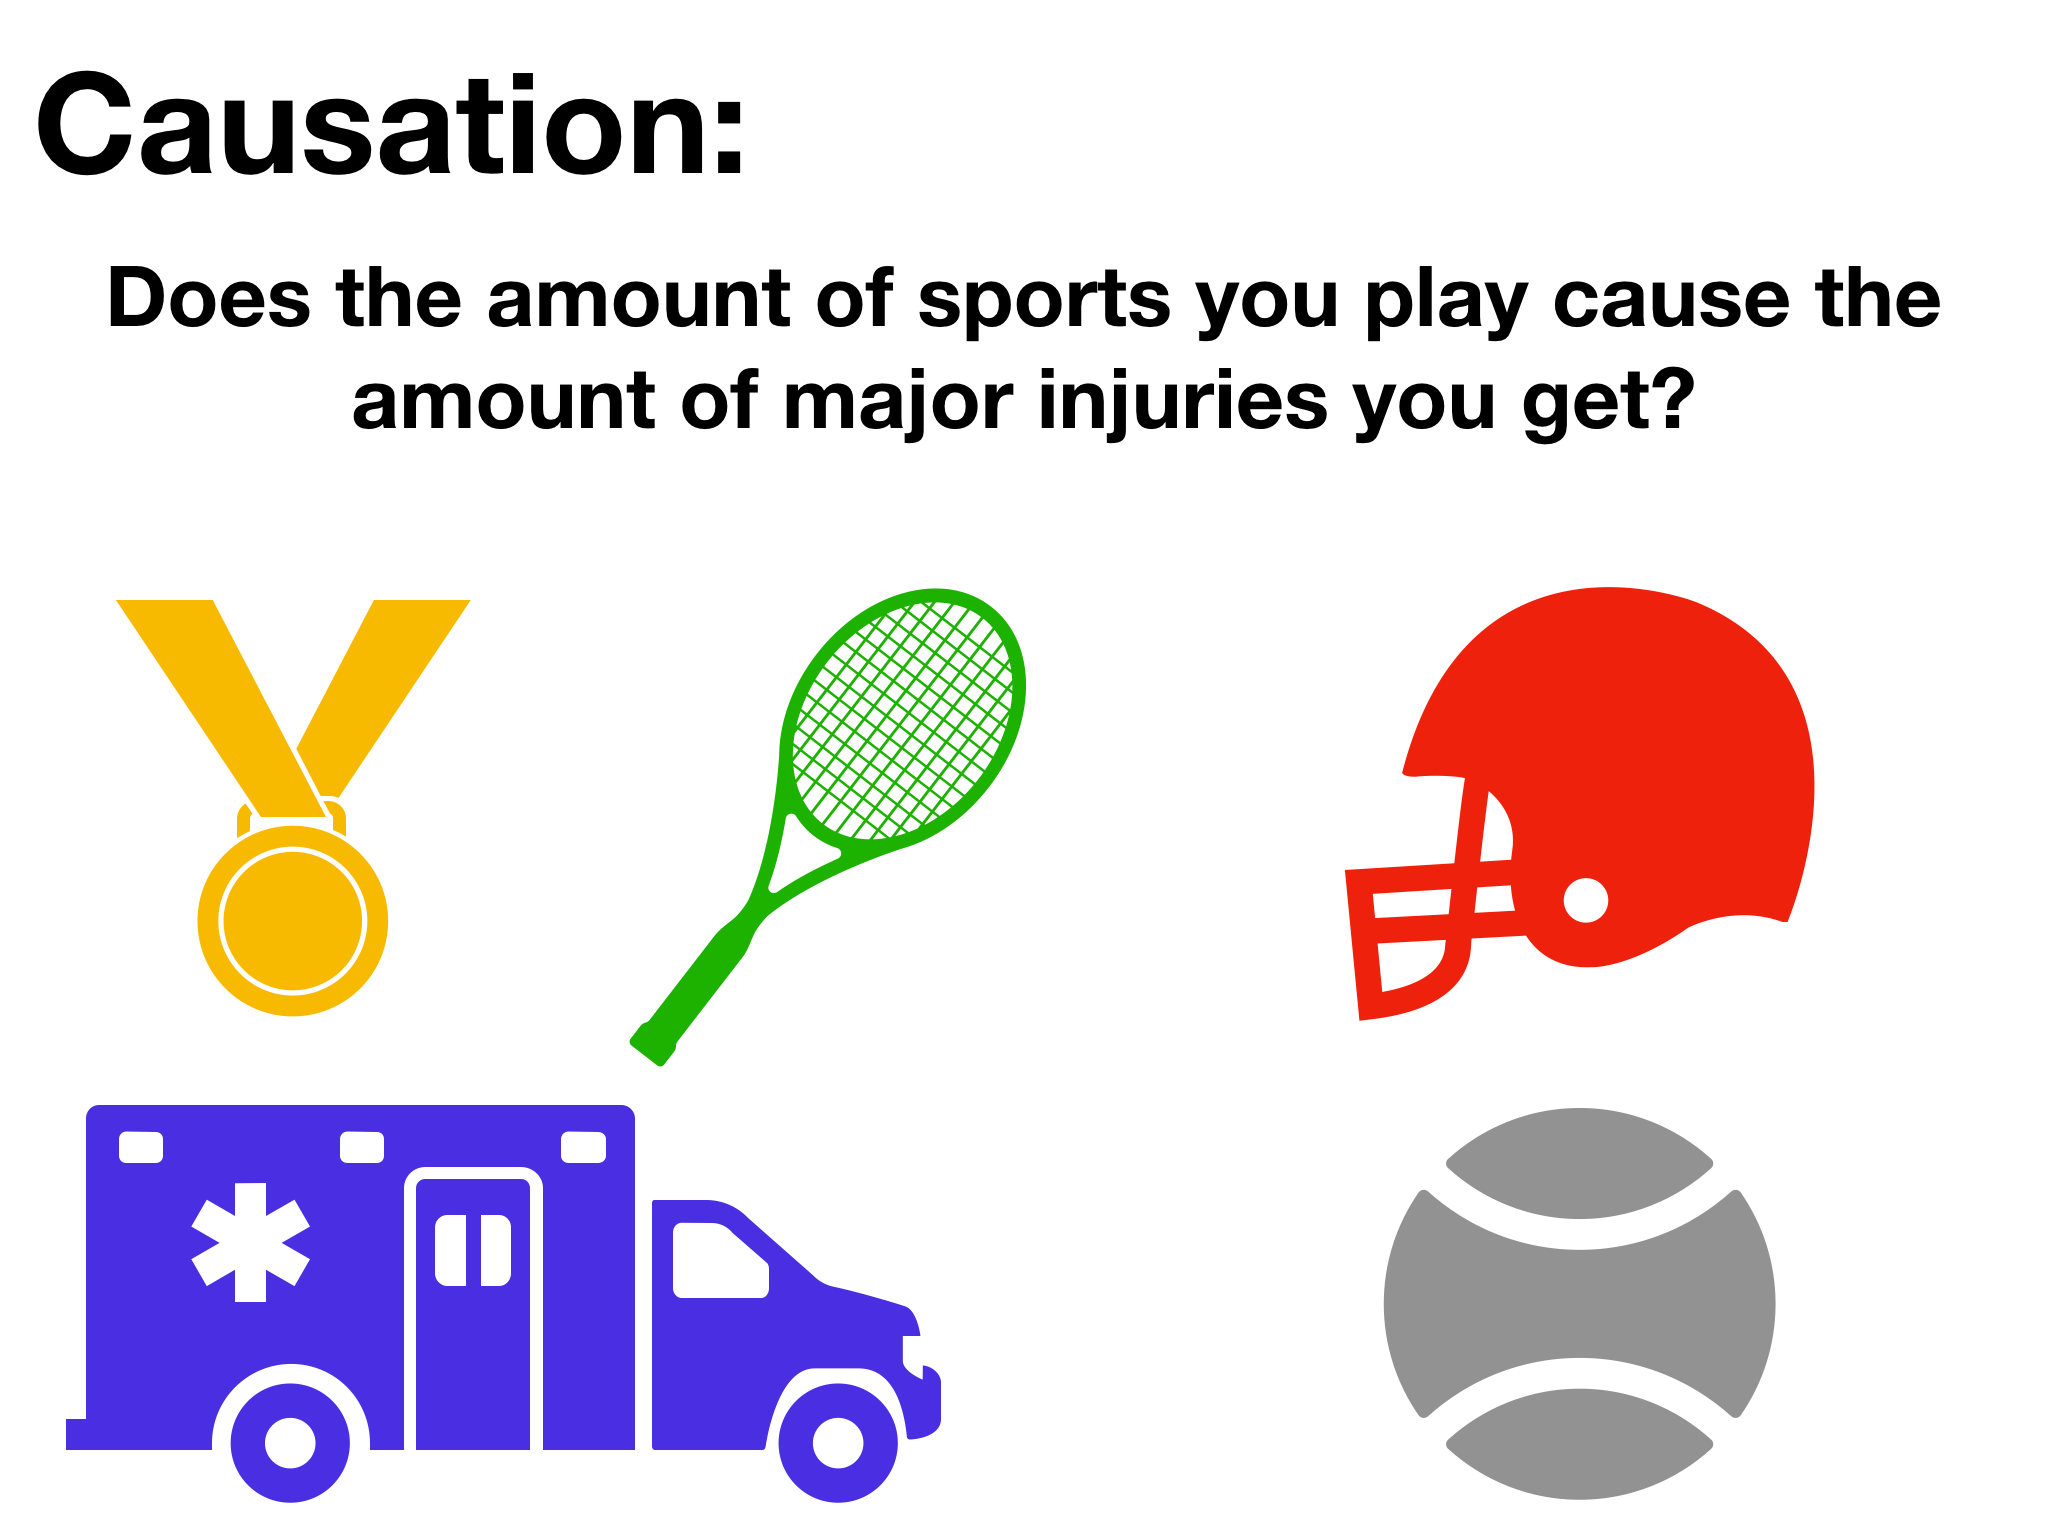
To start of the project, we first came up with our questions that we were going to later graph. One question was going to see if one thing causes the other. The other question was to see if two things correlate.
Questions:
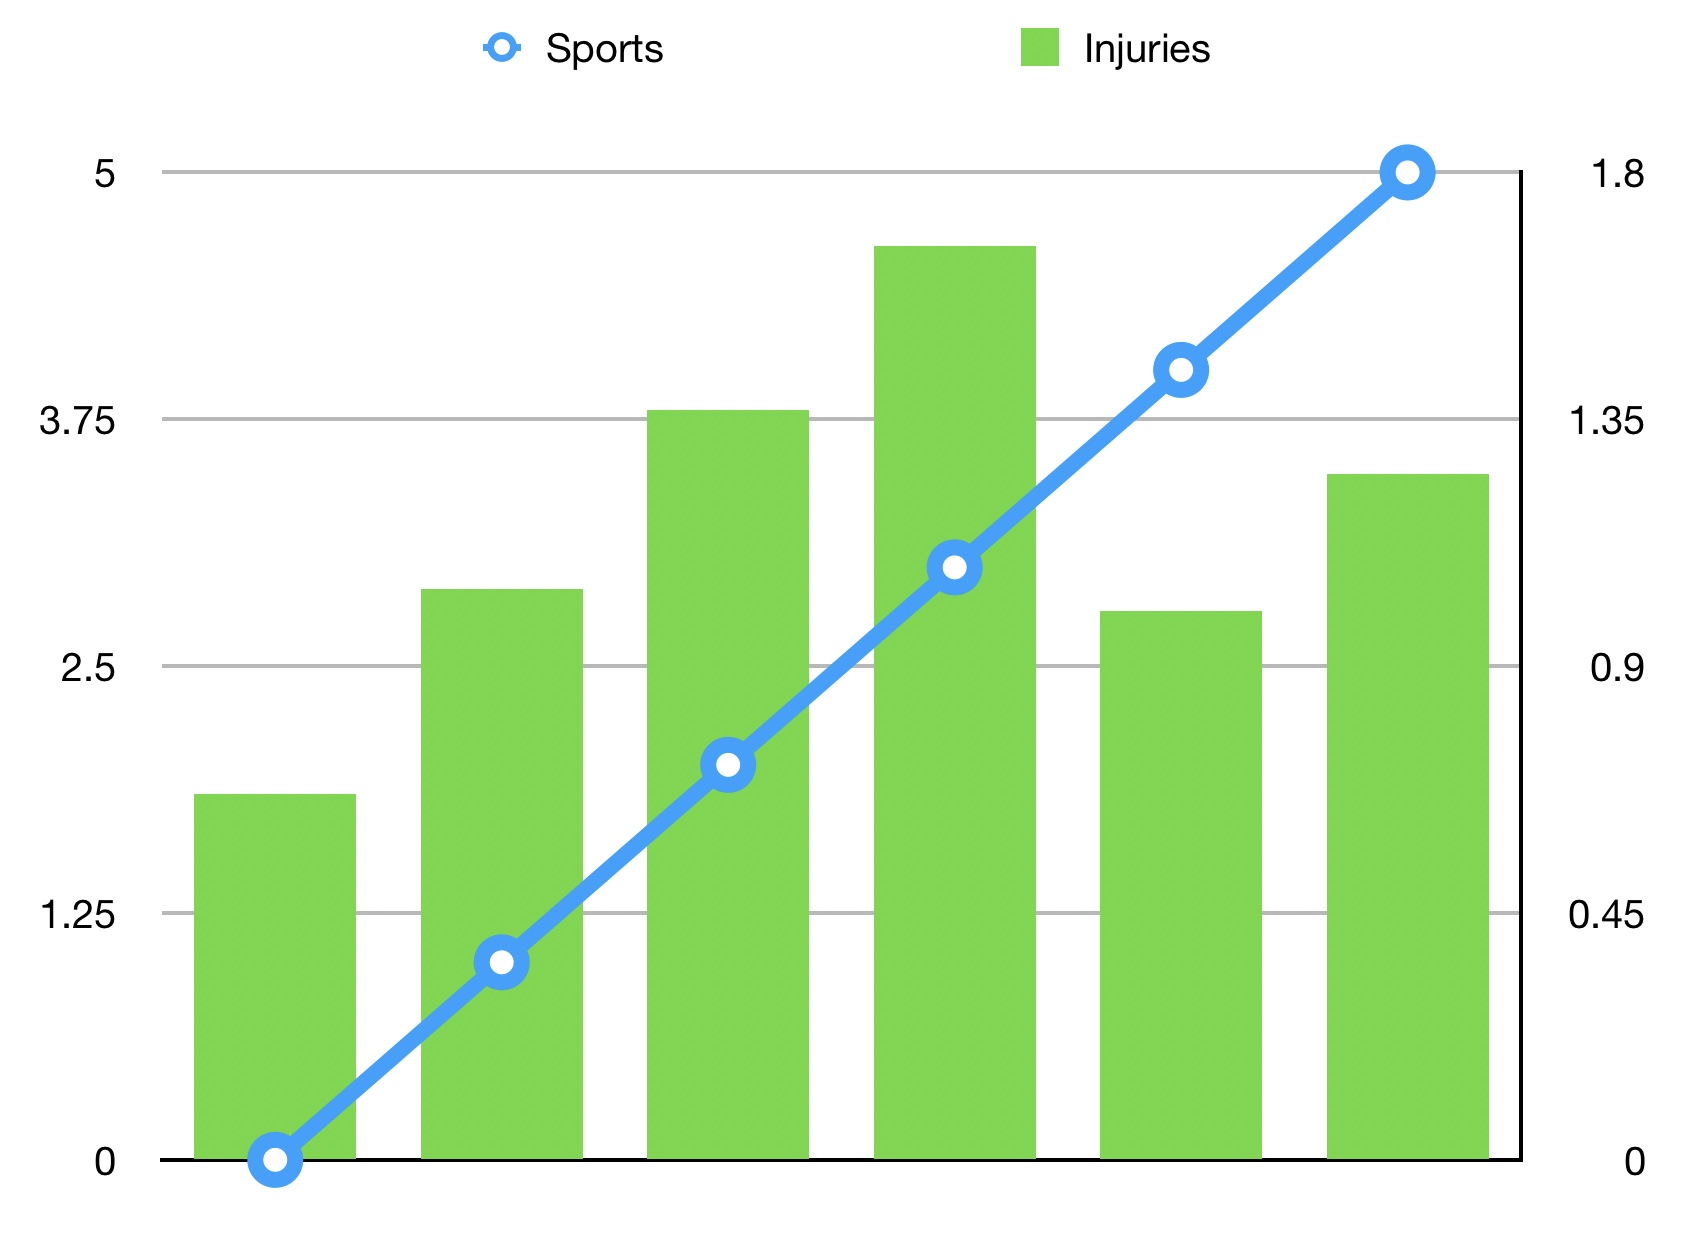
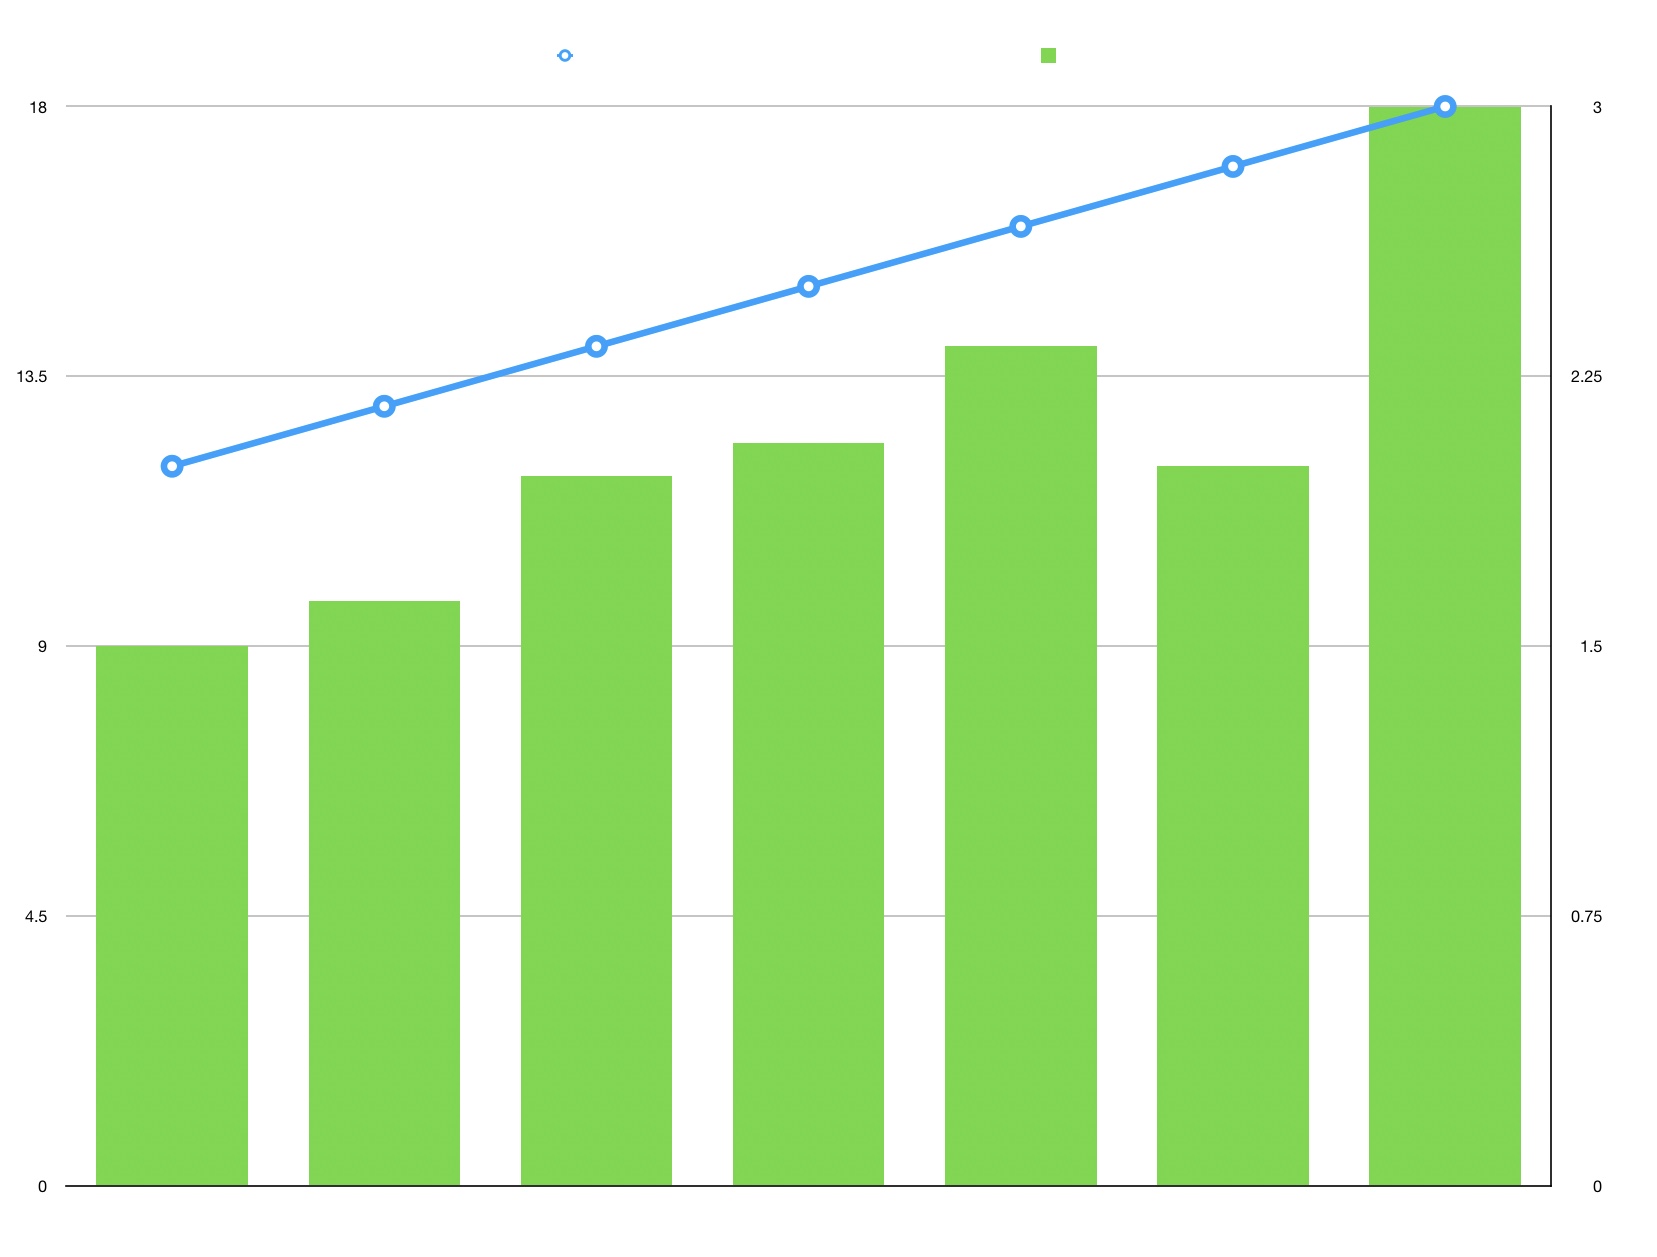
To get our data, we created a survey, and sent them to our friends. After about a day, we got over 100 responses, which was great! We took that data and put it all into a chart. Afterwards, we used the averages if each topic, and used those to make our chart.
Then, we found the mean, median, and mode of all the numbers.
We presented our project, and explained all the aspects of where we went wrong, were we succeeded, and everything around that. Our presentation went very well!
