Hello readers, for the past few weeks in Scimatics 8 we have been working on a project called “The Fractions of your Time”. The goal of this project was to track our screen time and to also get a better understanding of what we do every day. We tracked our screen time from Wednesday the 18th, to Tuesday the 24th of November.
The driving question in this project was “What fraction of our time is screen time?”. For me, the answer to that question is that three tenths or 30% of my time is screen time.
The milestones that helped me answer the question and create the final product the most are milestones 2, 3, and 6.
Milestones 2 and 3 were both quizzes about adding and subtracting fractions. They helped by giving me a chance to re-devollop my fraction skills, also by helping me to calculate the data in the power sheet and for the pie charts we made.
Milestone 6 was were we presented to the class our final product and explained what each pie chart displayed. This milestone helped me by giving me a chance to see my peers ideas as well as showing me what I could do better. Furthermore, the milestone helped by showing me how I could bring my work to the next level.
Here’s what my screen time spreadsheet looks like:
After seeing my classmates spreadsheets, I realized that mine was a lot different. For example, I didn’t include productivity hours on my iPad, and didn’t really have any personalized sections.
I wasn’t really surprised with the data because I know that most of my iPad time is for school, and that most of my phone screen time is my sister going on Tik Tok.
Also, here’s a link to the full version:
https://www.icloud.com/numbers/0o-Oe-Vb6aFwpE_kkj_SYvkSw#Screen_time_Tracker_2020
Here’s the graphs that I created:
The chart on the left displays how much of my time is spent off screens and how much is not. The chart on the right displays how much of my total cellular based screen time is spent on iPad as opposed to iPhone.
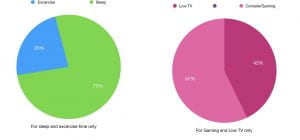
The chart on the left shows how much time I spend sleeping against how much I spend doing excersise. The chart on the right shows how much time I spend on TV as opposed to console gaming.
This chart demonstrates how much time I spent on screens each day.
This chart represents how much time I spent on each category throughout the week.
The 3 Curricular Competencies in this project were: Applying and Innovating, Understanding and Solving, and Communicating and Representing.
Applying and Innoavating: Contribute to care for self, others, community, and world through individual or collaborative approaches.
This Competency was excersised by using class time efficiently and by getting work done on time. My achievement on this competency showed development because in the past I wasn’t as efficient in getting things done and got distracted easily. I think that during this project, my level of concentration has just gotten better and I feel that I have grown a lot in this competency.
Understanding and Solving: Vizualize to explore mathematical concepts.
This competency was shown in this project by doing math worksheets, as well as small class quizzes. My achievement on this competency shows devollopement because I regained my fraction skills in this project and devolloped a better understanding of adding and subtracting fractions. I feel that this competency was most helpful in creating the final product because the main part of this project is adding and subtracting numbers to get data.
Communicating and Representing: Represent mathematical ideas in concrete, pictorial, and symbolic forms.
This competency was excersised in this project by creating charts and graphs to represent our data. I developed in this competency by seeing what others created for their graphs as part of the class presentations. That really helped me in taking the next step and improving my work, as well as discovering what more I can do with my iPad.
In conclusion, I really enjoyed this project and I found it interesting to track my personal screen time. It was also good to further enhance my iPad skills, as well as getting a better understanding of numerous apps. Furthermore, it was good to experience a project with numerous mathematical concepts in it. In all, this was a great project and I can’t wait for more like this in the future!


