Hello readers, and welcome back to my blog!
Today I’ll be writing about a project called “Correlation vs. Causation”. This project revolved around surveys and survey audiences. My partner in this project was Theryn, go check out his blog here: http://www.blog44.ca/theryns/
The driving question in this project was: “What’s the difference between Correlation and Causation?”. The difference is that Correlation means the there is a relation between factor A and B. Causation means that factor A causes B or vice versa.
To show evidence of my learning, I will be highlighting the milestones/stepping stones that helped me most in understanding the driving question.
The first stepping stone to mention is our textbook work. During this project, we went over several textbooks. These textbooks included information about different samples of populations, as well as different types of surveys that you can make. This helped me a lot because for our surveys,we had to target a specific audience.
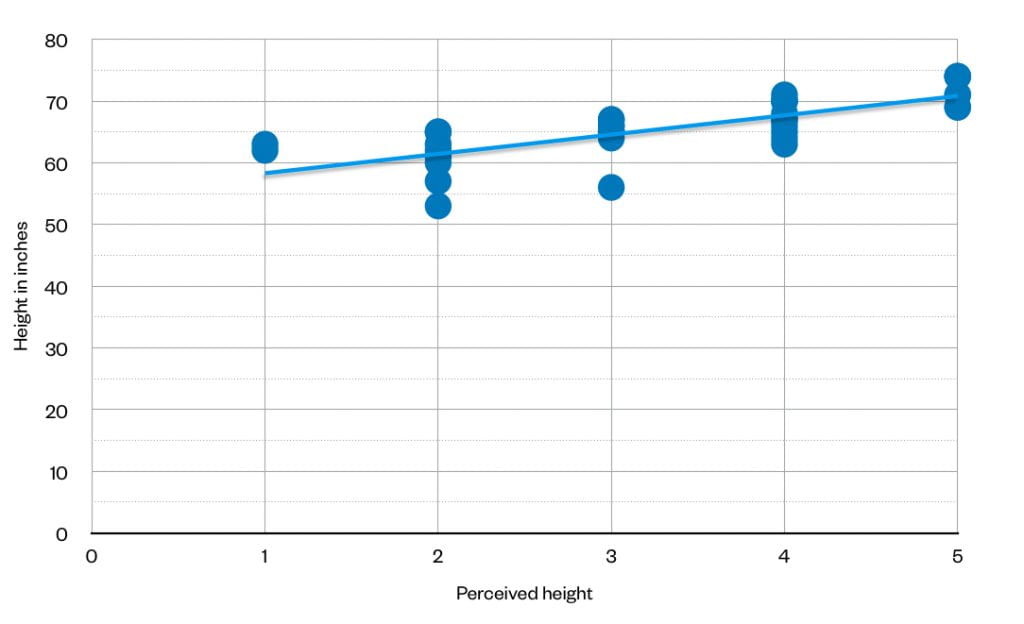
The next piece of learning that I am highlighting is our survey. In our survey, we were trying to correlate the number of friends one has with how many nicknames one had, this set of questions was also our example of causation. Also, we were trying to correlate how tall one is with how often one thinks about height. Unfortunately, our results didn’t turn out the way we wanted them to. Even though we received 40 answers, we found no correlation whatsoever. Our solution was to pull correlations from our other results. Nevertheless, we met all expectations in this project.
Here’s our final graphs;


 Now for the curricular competencies.
Planning and Conducting: Select and use appropriate equipment, including digital technologies , to systematically and accurately collect and record data.
I think I accomplished this skill. We posted our survey on Basecamp, as well as social media platforms. Even though our data wasn’t the best, we were still able to find 2 correlations and 1 causation. We showed this growth by presenting our project to the class and by explaining how we overcame different challenges.
Communicating and Representing: Use mathematical vocabulary and language to contribute to mathematical discussions.
I think we did well in this skill. We used the resources available to make good graphs that fully explain our findings. We used the app Numbers to track and organize our data. We learned to show that growth by including our graphs in our final presentation.
Applying and Innoavating: Contribute to care for self, others, community, and world through individual or collaborative approaches.
At first, I didn’t understand survey ethics at all. Using the textbook, and information from others, I was able to understand more thoroughly. In the end, I had an accomplished understanding of this skill.
In summation, this project taught me how to properly conduct surveys. Specifically, I learned to be ethical, and it taught me the difference between correlation and causation. Looking back, I would’ve made significant changes to my survey. For example, I would’ve altered my questions that resounded more with the audience. Also, I would’ve created more questions so that more correlations are possible.
Thanks for reading!
