For this project we had to track our screen time for a week. This included phones, iPad, computers, gaming consoles, TVs and more. You could also track other things such sleep and exercise.
Applying and innovating
For this project I used my time efficiently by working on the task at hand during school and out of school too. I was focused on task and handed all my assignments in. I also focused on the task and was not distracted. My desk parter and my self always helped each other on every step and helped each other to figure out the answers and make our products better. I used my knowledge of technology to make my project very appealing. I made the graphs bars colourful I made the colours on the pie charts or graph very eye catching. I also put detail into all my work by organizing all my things neatly. I used my knowledge of technology to make my project very appealing. Whenever my table partner Dylan was stuck on something or when I was stuck on something we would help each other understand the question. For the spread sheet I tracked my screen time on my phone, iPad, and tv. I also tracked my sleep and exercise. I showed my averages for the week and made pie charts and graphs to show my work.
Understanding and Solving
When doing my math I understood my work and showed it on my quizzes and worksheets. There was one part that made a little bit of sense but a few minutes of thinking I got it and did well. My spreadsheet was organized and the math was correct. My pie charts and graphs were detailed and appealing. The average screen time and the fraction of time that was spent was there. I had my spreadsheet which was extremely organized and showed my averages my total and all the stats that were necessary. My screen time went up on the weekend and then was the least on Wednesday.
Communicating and Representing
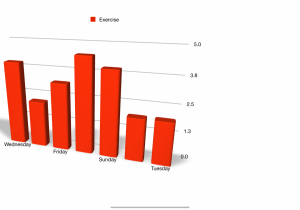
For my visuals in my project I made 4 pie charts on different things that could be noted. They were very colourful and looked well done. I also made a bar graph to show my sleep which it looked kind of weird because it showed all the bumps for all the days but 2 days looked like one which was just how it was made. The last thing that I made was another graph which will be down below showing my exercise. This was pretty detailed and helped attract attention to my project. Overall I think my best part of my project was my visual objects which explained my stats a lot easier than my facts. 
Some evidence of my learning was that I got 10/10 on two of our quizzes which there was only two. I also think that my work looked more professional when I made more drafts. I think that milestone 6 helped because it was the end and also just going up and presenting is very important and shows your confidence and knowledge in your project. I think overall all the milestones helped me to build up to my final draft. I could go on and on about which milestones helped me the most but I think that most of them helped to make my draft the best it could be. I was kind of surprised while watching people present how much of your week is just going on your electronics. My percentage of time spent on my electronics was 25% or 1 quarter of my week. My sleep average was 10.2 hours a day and my exercise average was 3 hours a day. My average screen time was 6.5 hours a day of all screens together. I was not really surprised by these stats. This was my answer to our driving quest which was “what is your average fraction of screen time per day”. Another thing that was important was my productivity verses my entertainment. Around 30% of my screen time was productivity and 70% was entertainment and games.
Overall this project taught me about how are days are broken up to and how productive we are. It also taught me about how we can waist lots of our precious time on electronics. There were also some positives to such as my exercise and sleep which was really good and I was proud of it.
This is my partner Dylan’s blog go ahead and check it out. http://www.blog44.ca/dylans/
This is a link to my project.
I like that you credited your partner by linking his blog! Also, the mountain photo you have as your blog “header” looks super cool. Nice work! 🙂
Thanks yours is great too