Saltier than The Dead Sea
“It’s Dead”
This most recent unit of Scimatics 10 was based around linear equations and bodies of water changing.
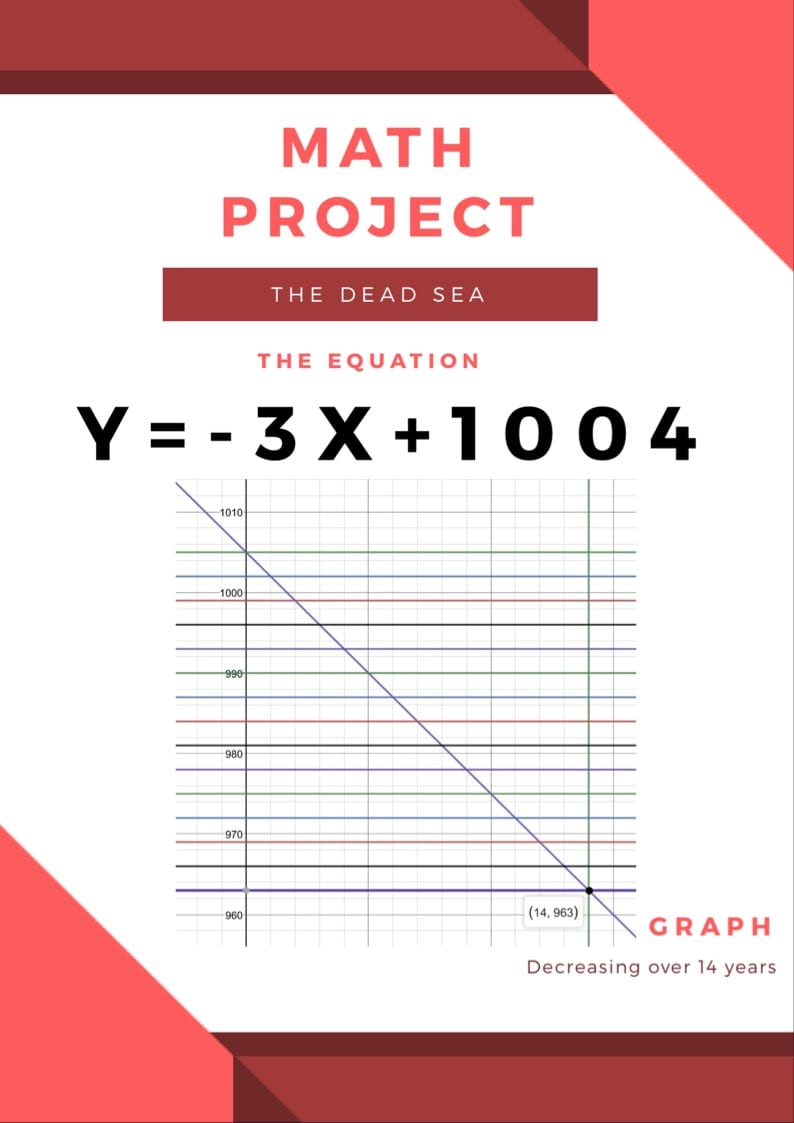
In the video above, Jessie and I explain why a 15 year old should go visit the Dead Sea in another 15 years, for their 30th birthdays. When presenting this video to our class we also shared information live before the video to explain the math a little better. We use this image as a way to create a visual for our explanation;
These are the competencies that we used in this project:
Model With Mathematics in Situational Context–
 In our project, we showed models of mathematics in a situational context by putting our
equations and ideas into a video about one situation- in this case, a trip to the Dead Sea, showing data of what people needed to know (mathematically) about the Dead Sea at that time.
Visualize to explore and illustrate mathematical concepts and relationships–
 Our video visualizes our math in a creative animated way that shows both concepts and the
reasons behind them in a fun and easy to understand way. We show a graph that illustrates the way that water is rising in the Dead Sea, and use our video to explain the growth or loss of watcher over the next 15 years.
Represent mathematical ideas in concrete, pictorial, and symbolic forms–
Our graph represents our mathematical ideas in our project. It shows the math we have been doing, and is explained by us to show how well we know the math and what happens in our work that we’ve been doing. We use our graph to show the equation, the algebraic explanation, and the reasoning behind our projects logic.
Connect mathematical concepts with each other, other areas, and personal interests–
 We connect our math with person areas and interests by putting it into a project based around an idea that people our age may want to see the Dead Sea in 15 years (when they are 30). We base the project and the math around that, and bring it up continuously through our video and keynote presentation.
