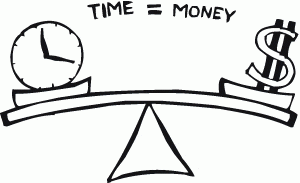
This Scimatics project was called time is money. Time is money is a saying that means to earn money, you must use your time which is just as valuable. This project was about creating a product or selling a service. With the data that you would get from this product/service, we would need to construct a graph to analyze what the future of our business would look like. The data we would be collecting would be our income, time, and startup cost/expenses.
I decided that for my service I was going to pressure wash. After I gathered all of the materials that I would need, I started to record the data. With the data that I then collected from my service, I was able to put it into a proper equation so that I could put it on a graph. I used this application called Desmos which helped with building the graph. Finally, I was able to construct the graph and observe how my business would look in terms of income for the future. If you want to learn more about this project, the final project video will be below.
Understanding and Solving:
I did good with the understanding and solving competency because I made sure that I was organized well and had everything prepared to start my service. I also made sure that all of my information was properly recorded. To record the time that I’d work, I would set a timer to go off every hour and record the data in a chart. I could have talked more about the materials and equipment that I used for the service.
Communicating and Representing:
I did good with the communicating and representing competency because I was able to create a proper linear equation that helped me with graphing all of my data. I was able to construct a proper graph that would determine the earnings from my service over a year. In my final video, I also used arrows to point at the different parts of the graph and explained each part. I could have done better at showing/explaining how much much money would be made from the service in the future.
Connecting and Reflecting:
I did good with the connecting and reflecting competency because I showed how I graphed all of my data. I showed the people watching how they could make an equation out of any job that they had by changing 3 different variables in the graph. I could have done better at connecting my service to another career.

