Exploring European Exploration

Welcome to another summative post. Today, I am going to talk about our latest project on European Exploration. This was a three weeks long, and consists of five milestones. So, without further ado, here is the post.

The driving question for this project was: What Did European Settlement Mean For Everyone Involved? To answer this question, there are two thing you need to know first: what is European settlement, and who was involved, and this post is documenting how I found the answer to this.

We kicked off this project with our first milestone: a stream-of-consciousness writing about European Settlement. This was the first assignment of this project.

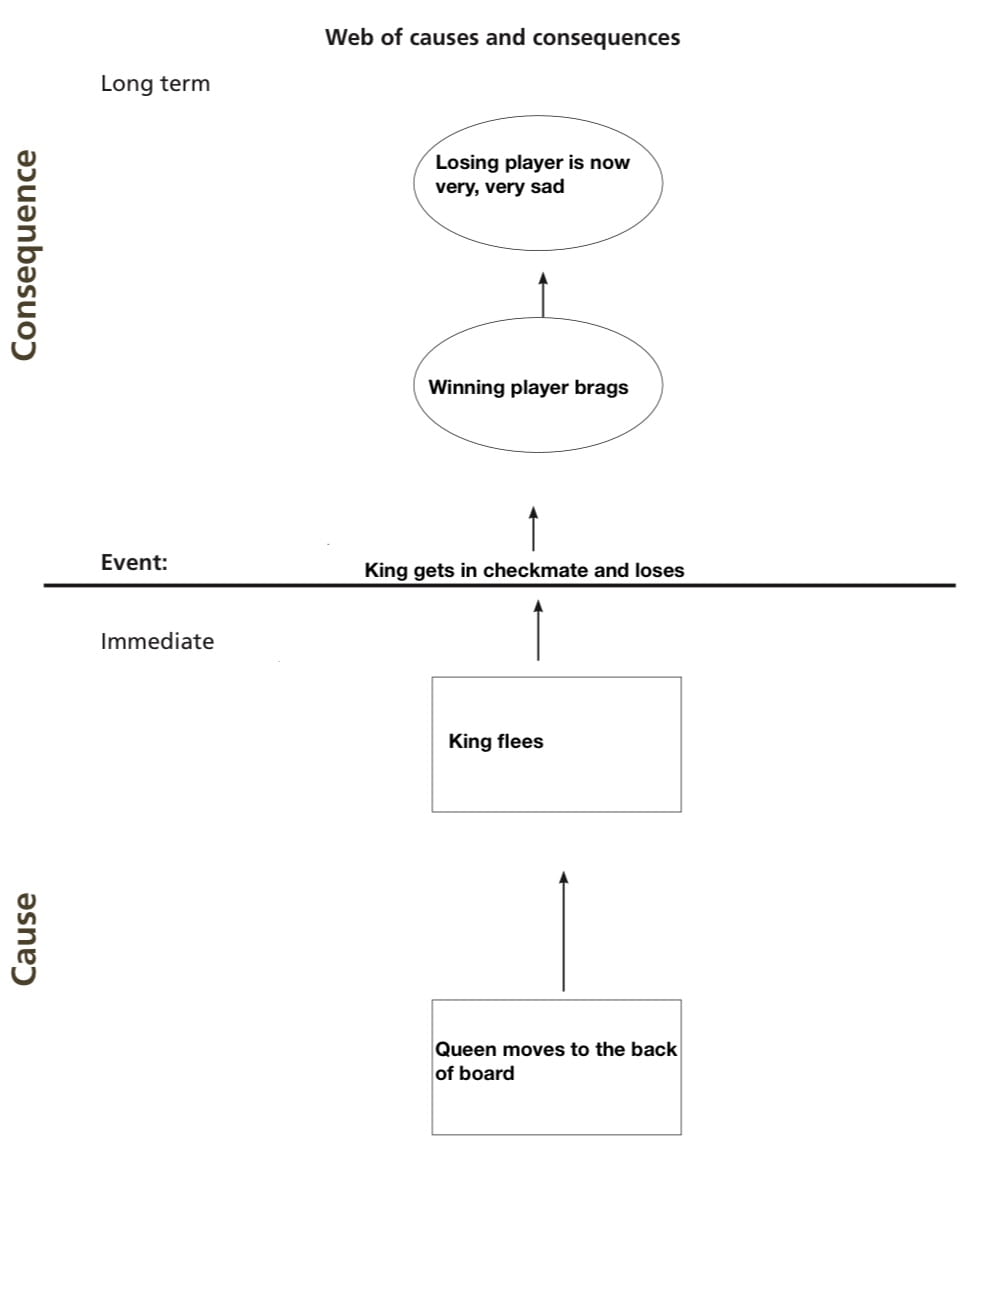
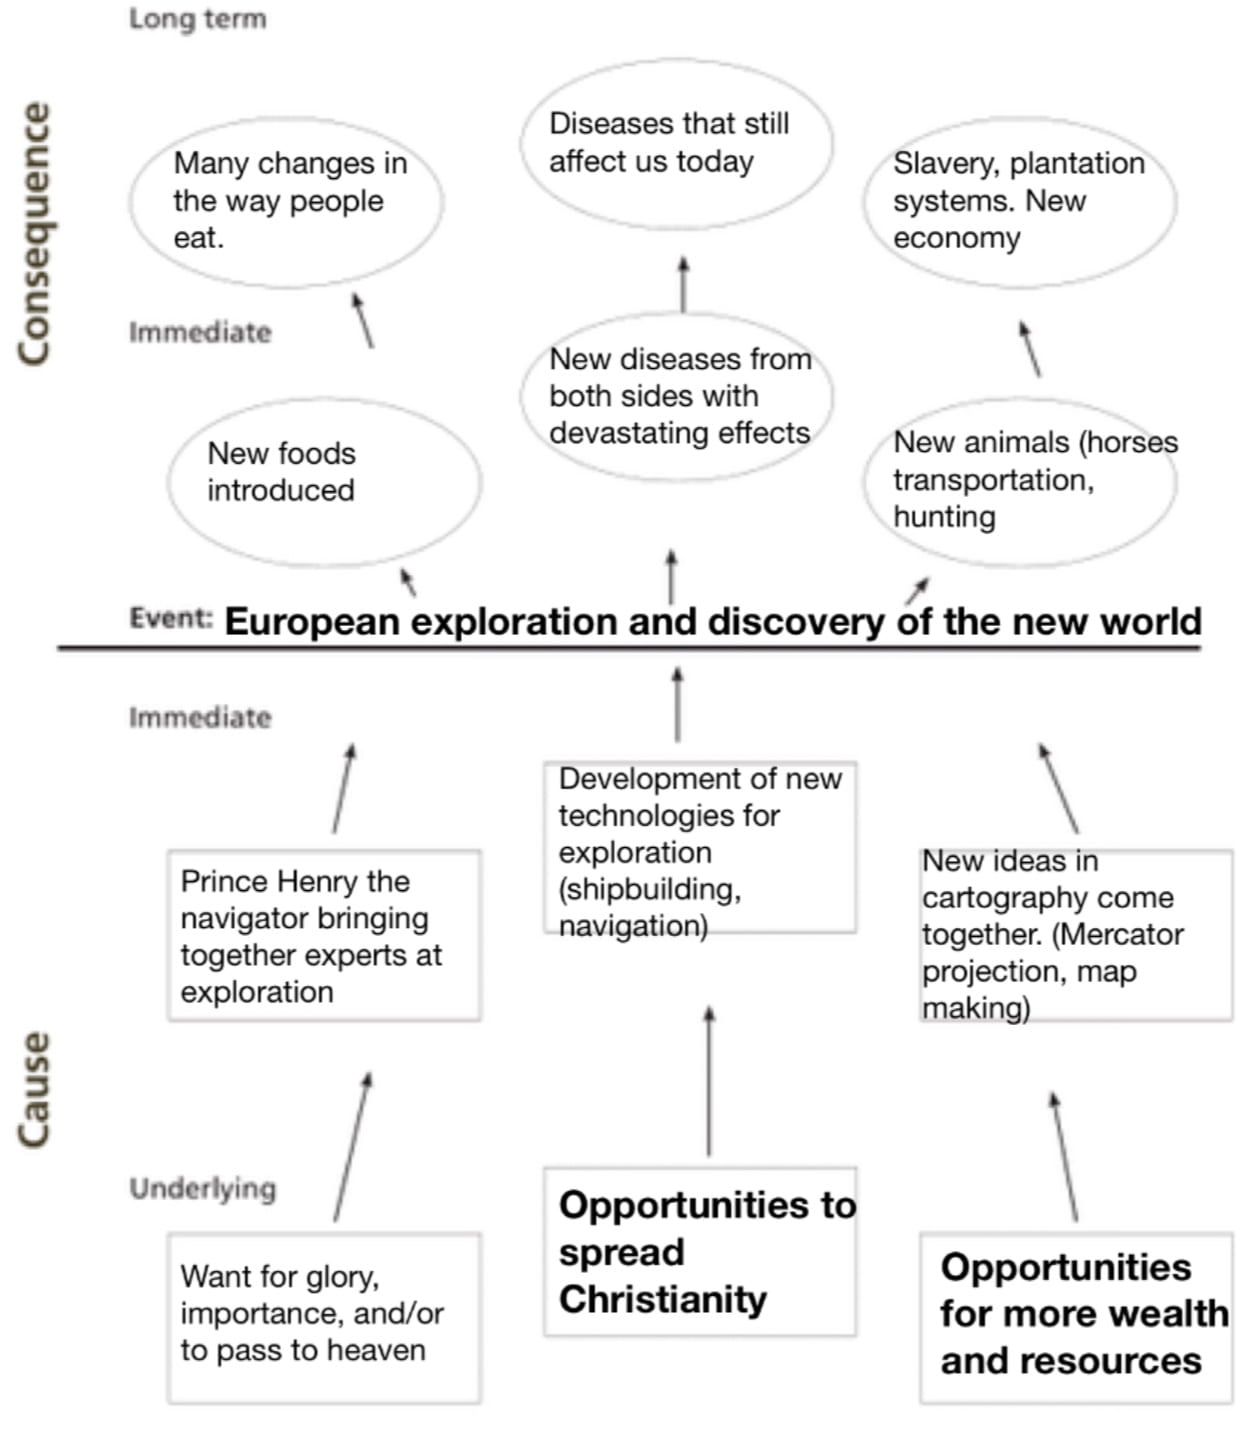
We did some other activities to build our knowledge, and then did milestone two, a sheet were we used evidence to rank events by significance on a chart. This is what it looked like:

Continuity and Change sheet

Throughout this project, me and my partner have been writing almost everything in one shared document. We have written scripts, notes, photos, content, and sources.

After we finished researching and creating our facts and graphics, we handed the rough infographic in as milestone three.

Milestone 3

Over time, me and Cale refined our infographic, and created six different version before the final product was created.

We then created a script, description, title, QR code, and Keynote magic move for our YouTube video.

Video Script
YouTube Information
QR Code To Video

Using all of this, we created the video which the QR code on the infographic leads to. You can find this video here.

And finally, we worked on putting all 26 infographics up around the school. We decided on were to put the infographics and which ones should go together, then put them up!

And that brings us to now, where I can answer the driving question: What Did European Settlement Mean For Everyone Involved? Well, the answer is complicated, because of how broad of an event it was. In my infographic, I focus on one aspect of it: alliance and trade. European settlement affected the First Nations, British, and French. Even today, and I’m sure for long afterward, trading will remain a constant. But what resources that are being traded, how they are traded, and the people trading them will always be changing. Alliances are crucial to humanity, and we are able to accomplish much more when we ally together. European Settlement gave new resources, trading routes, and opportunities for alliance to everyone involved, and that completely changed history for long after.

Thanks for reading my post! If you want to check out my partner’s experience with “The More Things Change” project, click here. Anyways, thanks for reading my blog and see you in the next post.

Argh, Matey!

For our second project this quarter, we did a project about the Age Of Exploration, and this is a summative post About my learning throughout this project.

To kick off this project, we watched a pirate movie based off of a real hijacking. We talked about pirates a bit, and then learned what cause and consequence are. Cause and consequence is how all events happen; they have a cause, and then more events because of it. We made webs of cause and consequence to practice this skill:

Chess web of cause and consequence

The whole project was about teaching us about the causes and consequences of European exploration. The driving question was: “What Was The Impact Of Global Exploration?”. To answer this question we first, you guessed it, learn what global exploration is.

Every day, we got a lecture on exploration, from the invention of new inventions like the caraval or astrolabe, to people who completely changed history like Christopher Columbus, or prince Henry the navigator. We did different reflection activities to help absorb the knowledge, like these below:

Sketch and Tell

Then, we did milestone 2, which was a large web of cause and consequence about the European exploration.

Large Web

We finally used our device skills to create a augmented reality presentation. This presentation was of a story written by me about the age of exploration.

And the answer to the driving question: the impact of global exploration is in the language we speak, the food we eat, and the things we do. The merging of cultures from global exploration caused many, many new things, and predicting the world without global exploration is nearly impossible, considering how much it changed the world.

Now, this project was a great journey, and I learned tons about our history. I also had tons of fun writing this post as well. You might want to check out some of my classmates views on this project too!

Sepaus

Colton

Thanks for reading my post! See you in my next one.

Student blogging challenge: the ACTUAL last day

Today, I am writing about the blogging challenge I have been doing for this whole quarter. So without further ado, here is the post!

When we started this project I will admit it: I really did not like the sound of making one blog post every day until the end of the quarter. But, as time went on, writing the blog posts quickly grew on me, and by the end, I really enjoyed writing the posts.

The first post in the challenge was an: “embedding content” post, and I wrote it about snowboard bindings. This post was pretty cool, but it was not my favourite post I have done. Honestly, my favourite post of all time is my blogging challenge day ten post, i am just really proud of all my photoshops, and had a ton of fun writing it.

I learned tons about embedding content, writing, and creating digital content in general. If you look at my first post in the challenge to the lat post, my growth is obvious. I will keep updating my blog and some previous posts, so stay tuned!

This has been an amazing challenge, and I appreciate you for reading along with me. See you in the next post!

Worldview Summative Post

Hello, and welcome to the summative post for the how it started/ how it is going project. The driving question for this project was: what can we learn from the past, and why does it matter to us today? To answer this question, we journeyed back through some of the most influential times history, travelled (virtually) to great museums, and finally, made a virtual museum all about worldview and historical events.

The project started with a mind map about museums and their specific features

Then we did milestone 1, which was a small museum exhibit representing your growth since the start of the year. I learned how to use many cool photo editing techniques like perspective shifting, light wraps, and more to do this. Our job in this milestone was to transform the idea of how it started/how it is going into a museum exhibit and provide evidence on my opinion. I believe I did this quite well, but if I did it again I would probably add a before/after comparison of my work as evidence. Click here for the PDF.

The second milestone was a collage of the important events in your life that shaped your worldview. To do this, we created a timeline of the important events in our lives, found or made pictures to represent those events, and created a collage of the images. This collage would later be revised and changed, and eventually become our “about me” at the start of the museum.

Then, we started milestone three: the history test. This was just one extremely hard question that made me (and some others) realize how little we knew (yet). This milestone made me realize the historical significance of the events I talked about, and decide which ones were the most significant.

We also did many, many other things to prepare for the museum launch, like an artist statement, script for the guided tour, the whole virtual museum, the final meme, a recorded artist statement, and a script for the zoom presentation. After all of that, we finally were ready to present the virtual museum to the world. In this virtual museum, we created modern artworks to represent our modern views of the themes in the older artwork, to show how much we have changed since then.

And with that, the driving question is answered: we can learn a lot front the past, and it matters today so we can learn and improve humanity by looking to the past.

Thank you for reading all the way down here! Of you want to see some of my group members veiw on the project (see what I did there?), click on one of the links below

Carter Aaron Noah

Final learning post of Fractions Of Your Time.

Here are some of the charts from my presentation.

In the project, Fractions Of Your Time, the driving question was: how much of my time is spent on screens? The answer to this question was far less complicated than that of the last project, the answer, simply, was: a lot. But, as with any PLP project, it wasn’t just about making one thing, there were many steps. (Less steps than I expected though).

The first step was a small survey that were completed in class (or a bit later).

Then we did some homework, (not to hard, as these were just refining our skills).

We also did a fractions quiz, which were actually pretty fun. Each day, we would fill out a chart containing screen time and other categories from the previos day.

We later presented these charts and made a fraction about how much of our time was screen time. That takes us to right now, were I am writing final blog post, to finish the project. I was surprised by the numbers on the chart, and making the chart was fun too.

These are the fractions and decimals of my time.

Curicular Competencies:

These are the things that we are graded on and strived to do. The first one; applying and innovating, was were we tried to use our time wisely and collaborate with others around us, to further learning and cooperation. I did this well, but not extending, as I used my class time productively, but didn’t go much beyond that.

The second competency is about visualizing mathematical concepts, which was rated by how well you can comprehend using fraction, percents, and decimals to show how you spend your time. We learned how to create spreadsheets and tables with mathematical rules built in to record our time, and as a plus, how much time we spend on screens.

The third competency, communicating and representing, is based on being able to represent ideas in concrete, pictorial, and symbolic forms. You proved this skill by using pie charts and tables to display an interesting proportion the variables of the chart display, and also show how much of an average day is spent on screens.