Atoms

As you can probably tell from the title, this project was one about atoms (and molecules, Kenetic energy, etc…). We spent about three weeks learning, coding and thinking to answer the driving question for this project: how can the behaviour of matter be explained by the Kinetic Molecular theory and the Atomic theory? So, without further ado, here is the post.

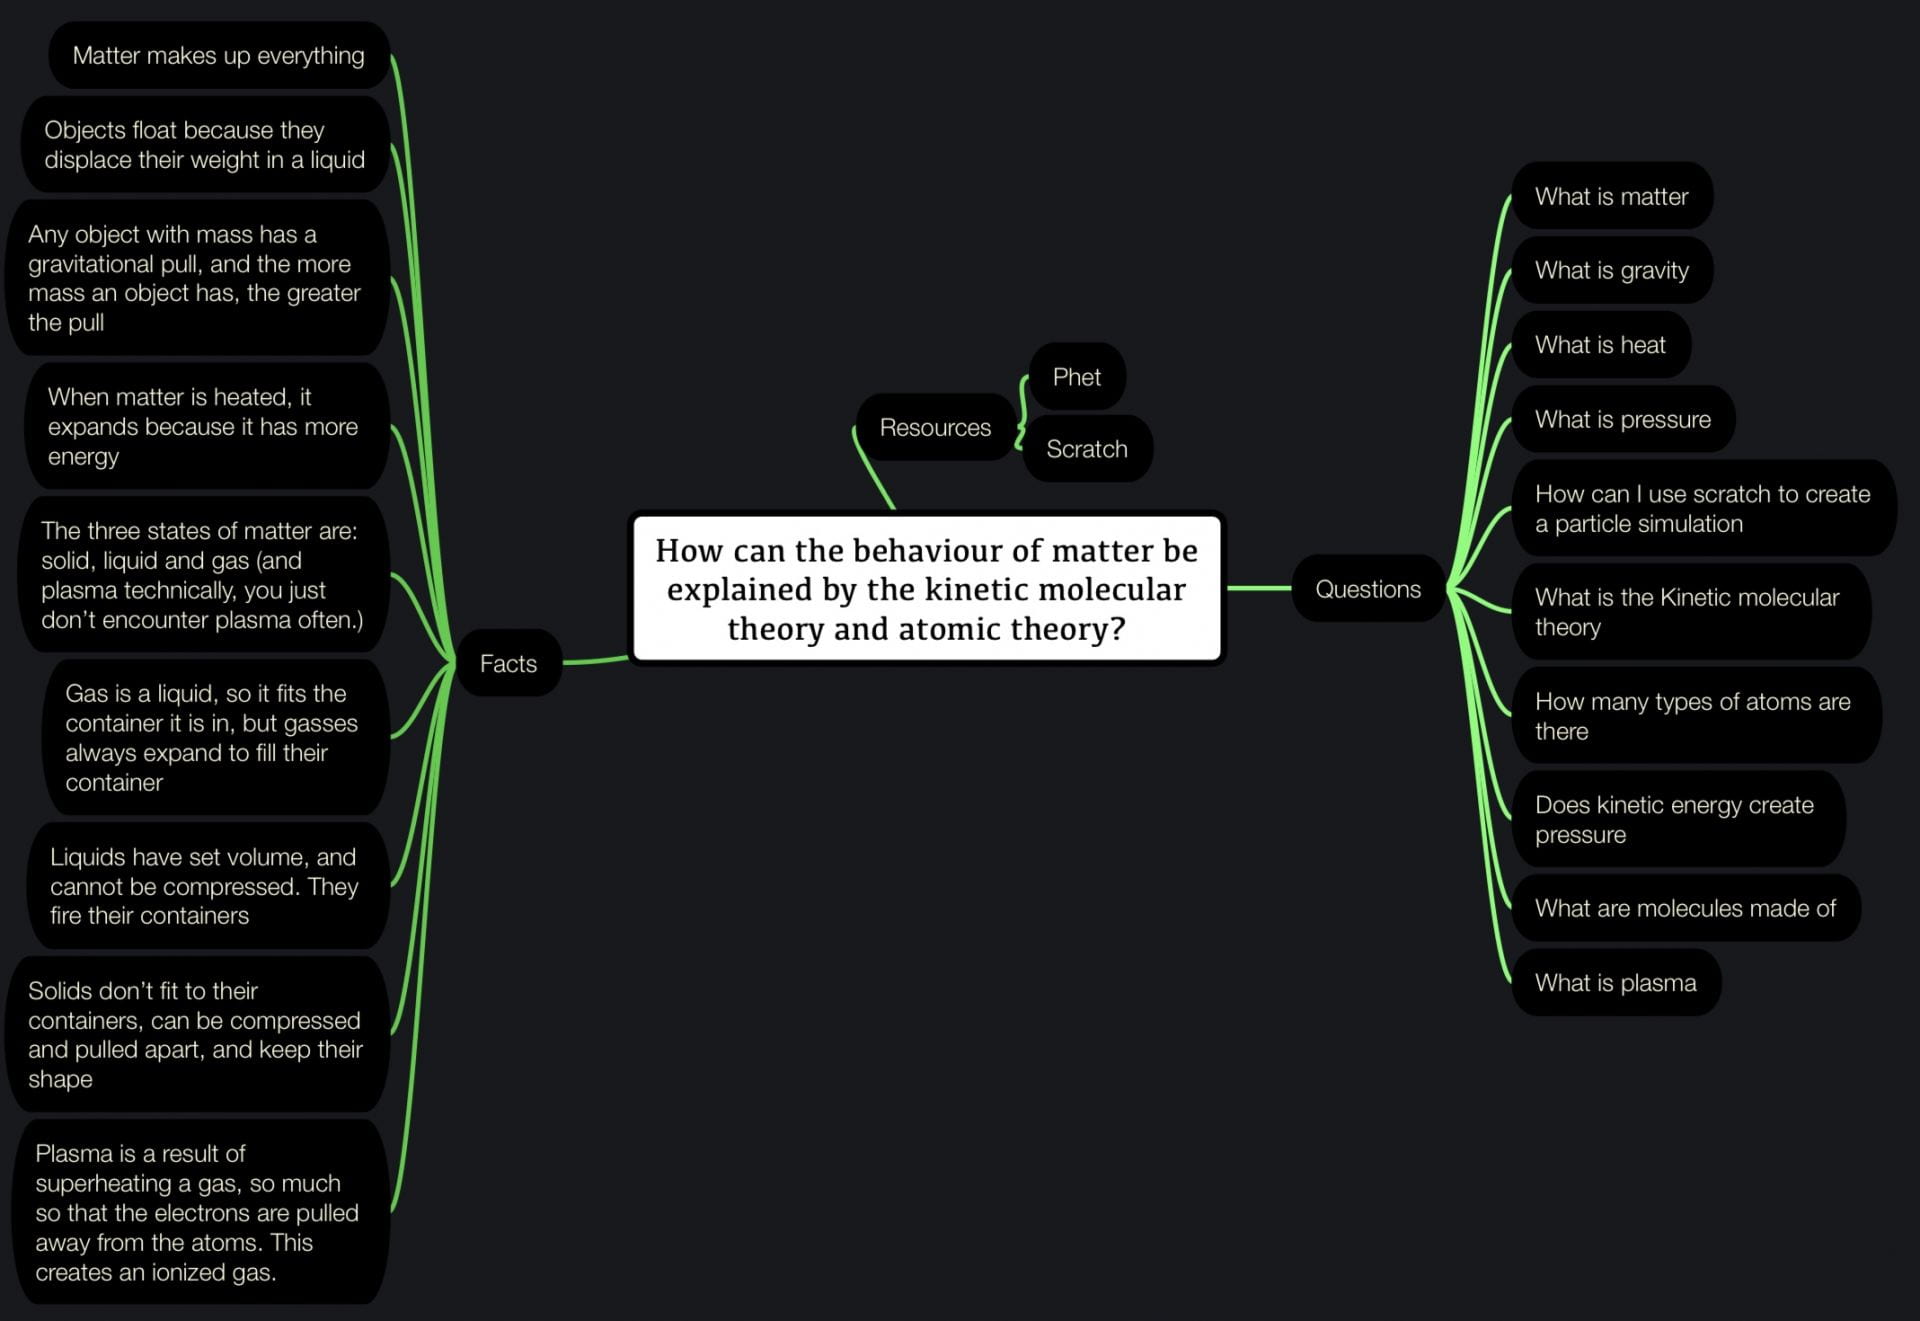
We started this project with a mind map and an experiment/magic trick. We wrote the mind map about what we already knew about matter, and then all of our questions about it.

Project start mind map

For the demonstration of atomic and molecular theory, the teacher performed a trick using a sealed bottle filled with water and an eyedropper.

The trick works by utilizing pressure. When the bottle is not squeezed, it looks like this:

Eyedropper at the top

But when the bottle is squeezed, the pressure increases, forcing the eyedropper down, and if you are subtle, it looks as if you magically made the eyedropper go down.

Squeezed bottle with the eyedropper down

One really cool activity was called the gemstone identification challenge. The whole class partnered up to measure the volume, weight, and then calculate the density of a few stones. The class average density was 3.74 grams per millemeter, and the closest density to that was that of colourless topaz, so we confirmed that the stones were colourless topaz.

Gemstone ID sheet

For milestone 2, we created accurate models for our coded project. In order to make our simulations or games follow this competency: Several different atoms/molecules, different states of matter, and particle motion are represented in the finished product. A historical model of the atom is chosen and implemented, we created some sort of model and text.

In order to create realistic and functioning models of atoms, molecules, and in my case quarks, I worked on three slides of information and graphics. It took three other versions to create to the one shown below.

The next week was mostly spent learning more about matter and coding or refining our scratch projects. Then we did milestone four, which was a coding plan for the rest of the project. This was my milestone four coding plan:

Features:
Press space to show Bohr models
Press M to mute music
Press N to unmute music
Press Q to create more clones
Press 1-3 to change molecule type
Gravity that can be turned on and off
Click the reset button to reset the simulation
Use the temperature slider to change how fast the particles move.
Setting the temperature to zero will stop the particles from moving, other than gravity acting on them.
You can create different states of matter by adjusting the temperature and gravity.
you can adjust how much gravity there is.
You can move between subatomic particle models, Bohr models, and no models by pressing space bar twice This kinetic molecular theory is included in the simulation when the particles move. They follow the Kinetic molecular theory.

After creating a plan, I continued coding my scratch project until it was completely done and polished. If you want to check out my simulator, click here. After all was said and done, I created a summative mind map of the project, which helped round of the end of the project.

As with all projects, there were curricular competencies which you can see below:

Questioning and Predicting: Demonstrate a sustained curiosity about a scientific topic or problem of personal interest.

All class time is used efficiently for learning without distractions. I used all my class time efficiently, and I am very proud of my final product.

Scientific Communication: communicate ideas, findings, and solutions to problems using scientific language, representations, and digital technologies.

Several different atoms/ molecules, different states of matter, and particle motion are represented in the finished product. A historical model of the atom is chosen and implemented. I have three different molecule designs: H2O (water), carbon dioxide (CO2), and ozone (O3). I also have three Bohr models of the elements: carbon, hydrogen, and oxygen, And finally two subatomic models of protons and neutrons.

Reasoning and Analyzing: Use logic and patterns (including coding) to solve puzzles and play games.

An interactive Scratch coded matter simulator or game is created with logical conditions and functional user controls. I created a simulator with four variables that the player/user can change, and extra aesthetic changes as well. The user can change limits all the variables, and the layout is logical and easy to use.

Thanks for reading my post! I had a great time doing this project, and i am sure to do more, so stay tuned .Even though I have featured it already, just in case, here is the link to my scratch matter simulator. Thanks to my friend Noah for all the coding help and feedback. If you want to check out his blog, click here. See you in the next post!

Exploring European Exploration

Welcome to another summative post. Today, I am going to talk about our latest project on European Exploration. This was a three weeks long, and consists of five milestones. So, without further ado, here is the post.

The driving question for this project was: What Did European Settlement Mean For Everyone Involved? To answer this question, there are two thing you need to know first: what is European settlement, and who was involved, and this post is documenting how I found the answer to this.

We kicked off this project with our first milestone: a stream-of-consciousness writing about European Settlement. This was the first assignment of this project.

We did some other activities to build our knowledge, and then did milestone two, a sheet were we used evidence to rank events by significance on a chart. This is what it looked like:

Continuity and Change sheet

Throughout this project, me and my partner have been writing almost everything in one shared document. We have written scripts, notes, photos, content, and sources.

After we finished researching and creating our facts and graphics, we handed the rough infographic in as milestone three.

Milestone 3

Over time, me and Cale refined our infographic, and created six different version before the final product was created.

We then created a script, description, title, QR code, and Keynote magic move for our YouTube video.

Video Script
YouTube Information
QR Code To Video

Using all of this, we created the video which the QR code on the infographic leads to. You can find this video here.

And finally, we worked on putting all 26 infographics up around the school. We decided on were to put the infographics and which ones should go together, then put them up!

And that brings us to now, where I can answer the driving question: What Did European Settlement Mean For Everyone Involved? Well, the answer is complicated, because of how broad of an event it was. In my infographic, I focus on one aspect of it: alliance and trade. European settlement affected the First Nations, British, and French. Even today, and I’m sure for long afterward, trading will remain a constant. But what resources that are being traded, how they are traded, and the people trading them will always be changing. Alliances are crucial to humanity, and we are able to accomplish much more when we ally together. European Settlement gave new resources, trading routes, and opportunities for alliance to everyone involved, and that completely changed history for long after.

Thanks for reading my post! If you want to check out my partner’s experience with “The More Things Change” project, click here. Anyways, thanks for reading my blog and see you in the next post.

Argh, Matey!

For our second project this quarter, we did a project about the Age Of Exploration, and this is a summative post About my learning throughout this project.

To kick off this project, we watched a pirate movie based off of a real hijacking. We talked about pirates a bit, and then learned what cause and consequence are. Cause and consequence is how all events happen; they have a cause, and then more events because of it. We made webs of cause and consequence to practice this skill:

Chess web of cause and consequence

The whole project was about teaching us about the causes and consequences of European exploration. The driving question was: “What Was The Impact Of Global Exploration?”. To answer this question we first, you guessed it, learn what global exploration is.

Every day, we got a lecture on exploration, from the invention of new inventions like the caraval or astrolabe, to people who completely changed history like Christopher Columbus, or prince Henry the navigator. We did different reflection activities to help absorb the knowledge, like these below:

Sketch and Tell

Then, we did milestone 2, which was a large web of cause and consequence about the European exploration.

Large Web

We finally used our device skills to create a augmented reality presentation. This presentation was of a story written by me about the age of exploration.

And the answer to the driving question: the impact of global exploration is in the language we speak, the food we eat, and the things we do. The merging of cultures from global exploration caused many, many new things, and predicting the world without global exploration is nearly impossible, considering how much it changed the world.

Now, this project was a great journey, and I learned tons about our history. I also had tons of fun writing this post as well. You might want to check out some of my classmates views on this project too!

Sepaus

Colton

Thanks for reading my post! See you in my next one.

Student blogging challenge: the ACTUAL last day

Today, I am writing about the blogging challenge I have been doing for this whole quarter. So without further ado, here is the post!

When we started this project I will admit it: I really did not like the sound of making one blog post every day until the end of the quarter. But, as time went on, writing the blog posts quickly grew on me, and by the end, I really enjoyed writing the posts.

The first post in the challenge was an: “embedding content” post, and I wrote it about snowboard bindings. This post was pretty cool, but it was not my favourite post I have done. Honestly, my favourite post of all time is my blogging challenge day ten post, i am just really proud of all my photoshops, and had a ton of fun writing it.

I learned tons about embedding content, writing, and creating digital content in general. If you look at my first post in the challenge to the lat post, my growth is obvious. I will keep updating my blog and some previous posts, so stay tuned!

This has been an amazing challenge, and I appreciate you for reading along with me. See you in the next post!

Worldview Summative Post

Hello, and welcome to the summative post for the how it started/ how it is going project. The driving question for this project was: what can we learn from the past, and why does it matter to us today? To answer this question, we journeyed back through some of the most influential times history, travelled (virtually) to great museums, and finally, made a virtual museum all about worldview and historical events.

The project started with a mind map about museums and their specific features

Then we did milestone 1, which was a small museum exhibit representing your growth since the start of the year. I learned how to use many cool photo editing techniques like perspective shifting, light wraps, and more to do this. Our job in this milestone was to transform the idea of how it started/how it is going into a museum exhibit and provide evidence on my opinion. I believe I did this quite well, but if I did it again I would probably add a before/after comparison of my work as evidence. Click here for the PDF.

The second milestone was a collage of the important events in your life that shaped your worldview. To do this, we created a timeline of the important events in our lives, found or made pictures to represent those events, and created a collage of the images. This collage would later be revised and changed, and eventually become our “about me” at the start of the museum.

Then, we started milestone three: the history test. This was just one extremely hard question that made me (and some others) realize how little we knew (yet). This milestone made me realize the historical significance of the events I talked about, and decide which ones were the most significant.

We also did many, many other things to prepare for the museum launch, like an artist statement, script for the guided tour, the whole virtual museum, the final meme, a recorded artist statement, and a script for the zoom presentation. After all of that, we finally were ready to present the virtual museum to the world. In this virtual museum, we created modern artworks to represent our modern views of the themes in the older artwork, to show how much we have changed since then.

And with that, the driving question is answered: we can learn a lot front the past, and it matters today so we can learn and improve humanity by looking to the past.

Thank you for reading all the way down here! Of you want to see some of my group members veiw on the project (see what I did there?), click on one of the links below

Carter Aaron Noah

Emoji Story!

Hello, and welcome. Today is the 7th day of the Student Blogging Challenge 2021, and the last day isn’t even based on words. No, it is based on a random emoji generator! So here is the story:

🚉 Everyday, the train would do what it has done for 46 years; go between two stations.

😵 but one day, a passenger boards the train illegally to escape the police.

🚦 because of that, the train locked all of its doors and stopped moving.

🐨 because of that, the koala onboard was actually helping the crook!

🏁 because of that, the train goes as fast as he can to the next station

🍔 until finally, the police arrest the koala and criminal.

The End

I hope you enjoyed my story, and until then, see you next time!

Music!

Hello! This post is day 6 of the 2020 Student Blogging Challenge, and today we are doing a post on music! I love to listen to music, and I can play guitar decently. And without further ado, here is the post.

Record Guitars

all hail the biggest of them all! In January, 2001, the largest playable acoustic guitar was created: measuring 16.75m long, 7.57m wide and 2.67m deep, and weighs four tons. The instrument was built in Porto, Portugal. This record still stands today. source here.

Running down the scale of size works too, clearly, or else why make a guitar smaller than as human hair? Yes, you heard me right, this tiny guitar measures ten micrometres long – 1/20 the thickness of human hair! It can only be played by using lasers to move the strings, and makes sounds at frequencies human can’t even hear.

source.

Minuscule or massive, we must pay respect to our elders. And the oldest and first guitar ever, owned by an artist known as Har-Mose, in ancient Egypt is no exeption. The guitar had three strings and was made of two pieces of wood, with no ability to tune it.

Survey

On that topic, I also made a survey about music Here.

Guess that instrument

Now, here is a guess that instrument quiz.

You have finished the post! Congrats! But, if you look at the start of each paragraph, they are in perfect harmony.

Worldview in photos

“Logical mind”

Worldview

This art represents the values aspect of worldview because of how I value logic and, like most people, organization (some people just don’t have enough time or effort to spend on it). And organization, at its core, is just looking for patterns and finding them consistently.

In this picture, the lines become more uniform as they go to the right side of the page, showing how my brain analyzes what it sees to find patterns.

Creation

To make this, I used the app SuperimposeX, which is a paid software used for photo editing, art, and much more. For people like me, who don’t currently have a steady hand for drawing, this app can help me make art in a different way. The link to this app is Here.

The way I created the lines was by putting each line on a different layer, adding a swirl effect on each layer, the amount decreasing with each line until I just drew a straight line. Then, I added a darkening gradient across the screen and randomized the thickness of each line. Finally, I merged all the layers except the last two and added a small ripple effect to add a bit more randomness to the non-straight lines

Process

The final product you see above was not the first one however, so here are the other takes:

Laser laws final post

Hello, and welcome to anotherblog post. In this post I am going to show all I have learned throughout the laser laws project. First, I’ll start with the driving question: how can I test Pythagorean theorem and the law of reflection. There are many ways to test this, but first we had to build our knowledge on the subject by completing worksheets and doing cool science experiments. For example, at the start of the project we played laser tag, were there are two teams and they both try to shoot the other team’s target with their laser, while protecting their own. There was not to much to be learned from this activity, but it was a fun intro to the law of reflection. After that we did a project start mind map:

Project start mind map

And along the way, I added to the question section, and also answered them all in another mind map at the end of the project:

While mind maps are all fun and good, though, we still haven’t actually tested the law of reflection or Pythagorean theorem. We did a small workbook to get up to speed, and then did a really cool experiment about the wave model of light. Here is the experiment:

in the waves lab, I learned a lot about the nature of light, and how there are multiple models that can be used to define it. We were then split into groups, then did an experiment on Pythagorean theorem. In My groups’s experiment, we tested to see if you can use Pythagorean theorem to get the values of the two legs with only the hypotenuse. The answer was no, but if you know that the legs are the same you can do it.

This is the expirement

In my second milestone, we did a khan academy test to check our understanding. Our third milestone was yet another experiment, this time testing if the law of reflection can be used to make shapes.

After this, we started on milestone four, the design for our laser triangle. This design may or may not be used as the final design, but it is a crucial step nonetheless. There were three revisions of this, but here is the final one:

Final experiment

Then, it was time for the final design. The groups started to set up the mirrors, prepare the laser circuits, and do all-around finishing touches.

Then all the groups set up their projects near the smoke machine, then we all got really cool views of our work coming together.

This is the final laser display!

I overall learned a ton from this project, from how to measure est sides of a triangle to the different models of light

And, finally, the curricular competencies:

The first of three, questioning and predicting, is about ‘‘Demonstrating a sustained intellectual curiosity about a scientific topic or problem of personal interest’’ I think that I did this quite well, as I was on task and very interested in the class.

In the second, Questioning and predicting, you must ‘‘Demonstrate a sustained intellectual curiosity about a scientific topic or problem of personal interest’’, and I did well in this, because i had so many questions about the law of reflection and Pythagorean theorem. Luckily, google search, textbooks, and class resources exist.

The last but not least competency is applying and innovating: cooperatively design projects. I believe I did this well because our group got along well and our final product checked all boxes

And, the answer to the driving question: out of the many ways you could test the law of reflection, by far the simplest is to just grab a mirror and shine a laser on it in a dark room, and take a picture and measure the angles in it. To test the Pythagorean theorem, you could draw right triangles with random side lengths, then use Pythagorean theorem to solve for the missing edge. Then, check your answer using a ruler or, the measure app.

Tectonic Chances Summative post

Hello, and welcome to anotherblog post! In this project, the driving question was: how are thematic and mathematical elements used in board games?

The answer to this is: they can add a touch of realism, role playing, or just a cool element to your game. Thematic and mathematical elements can and are used in board games all the time, for example: chess; which uses medieval figures to add a slight bit of logic and realism to the game, which helps connect players to the game a bit more. In other versions of chess, they use other themes to make the game more applicable to different audiences. Or in games like pandemic: contagion, where tons of different chances are balanced to create a fun and diverse game.

Anyway, to get this answer, we had to do many activities, like learning about tectonic plates in order to make a game about them, doing a mind map, listing the scientific elements they will be in our game, and finally making actual game rules and a playable game and presenting them to other groups in the best way: playing them!

The first thing we did was make some rough game rules (which, in my group, weren’t used later on) on whiteboards.

This was the original mind map, but my game was changed a lot later

And, as with each project, there were curricular competencies that everyone strived for.

The first: evaluating; demonstrate an understanding and appreciation of evidence. in the criteria for this competency, it states that there should be evidence of 10 key science concepts in your game, and game pieces should visually represent tectonic concepts. I think I this because my game had 10 science concepts: convection currents, mid-ocean ridges, volcanoes, earthquakes, ridge push, subduction, reverse faults, normal faults, and strike-slip faults. Speaking of which, click here for said game rules.

Onto the second competency, questioning and predicting. I think I used most of my class time efficiently and well, because I finished all work on time and did most of it in class. I also handed in first drafts of my work early for feedback.

The third competency, understanding and solving, is all about demonstrating understanding of mathematical concepts through play, inquiry, and problem solving. I think I did this because my game has lots of probability that is calculated at the end of the rules. At the end of my rules, there are multiple probabilities calculated correctly, and there are examples of turn outcomes stated.